Data Visualisation#
In this tutorial we’ll visualise the signals in a MIMIC Waveform record.
Our objectives are to:
Plot one minute of signals from a segment of data
Look more closely at the shape of the PPG pulse waves
Setup#
Resource: These steps are taken from the Data Exploration tutorial.
Specify the required Python packages
import sys
from pathlib import Path
Install and import the WFDB toolbox
!pip install wfdb==4.0.0
import wfdb
Requirement already satisfied: wfdb==4.0.0 in /opt/hostedtoolcache/Python/3.10.14/x64/lib/python3.10/site-packages (4.0.0)
Requirement already satisfied: SoundFile<0.12.0,>=0.10.0 in /opt/hostedtoolcache/Python/3.10.14/x64/lib/python3.10/site-packages (from wfdb==4.0.0) (0.11.0)
Requirement already satisfied: matplotlib<4.0.0,>=3.2.2 in /opt/hostedtoolcache/Python/3.10.14/x64/lib/python3.10/site-packages (from wfdb==4.0.0) (3.5.2)
Requirement already satisfied: numpy<2.0.0,>=1.10.1 in /opt/hostedtoolcache/Python/3.10.14/x64/lib/python3.10/site-packages (from wfdb==4.0.0) (1.26.4)
Requirement already satisfied: pandas<2.0.0,>=1.0.0 in /opt/hostedtoolcache/Python/3.10.14/x64/lib/python3.10/site-packages (from wfdb==4.0.0) (1.5.3)
Requirement already satisfied: requests<3.0.0,>=2.8.1 in /opt/hostedtoolcache/Python/3.10.14/x64/lib/python3.10/site-packages (from wfdb==4.0.0) (2.32.3)
Requirement already satisfied: scipy<2.0.0,>=1.0.0 in /opt/hostedtoolcache/Python/3.10.14/x64/lib/python3.10/site-packages (from wfdb==4.0.0) (1.14.0)
Requirement already satisfied: cycler>=0.10 in /opt/hostedtoolcache/Python/3.10.14/x64/lib/python3.10/site-packages (from matplotlib<4.0.0,>=3.2.2->wfdb==4.0.0) (0.12.1)
Requirement already satisfied: fonttools>=4.22.0 in /opt/hostedtoolcache/Python/3.10.14/x64/lib/python3.10/site-packages (from matplotlib<4.0.0,>=3.2.2->wfdb==4.0.0) (4.53.1)
Requirement already satisfied: kiwisolver>=1.0.1 in /opt/hostedtoolcache/Python/3.10.14/x64/lib/python3.10/site-packages (from matplotlib<4.0.0,>=3.2.2->wfdb==4.0.0) (1.4.5)
Requirement already satisfied: packaging>=20.0 in /opt/hostedtoolcache/Python/3.10.14/x64/lib/python3.10/site-packages (from matplotlib<4.0.0,>=3.2.2->wfdb==4.0.0) (24.1)
Requirement already satisfied: pillow>=6.2.0 in /opt/hostedtoolcache/Python/3.10.14/x64/lib/python3.10/site-packages (from matplotlib<4.0.0,>=3.2.2->wfdb==4.0.0) (10.4.0)
Requirement already satisfied: pyparsing>=2.2.1 in /opt/hostedtoolcache/Python/3.10.14/x64/lib/python3.10/site-packages (from matplotlib<4.0.0,>=3.2.2->wfdb==4.0.0) (3.1.2)
Requirement already satisfied: python-dateutil>=2.7 in /opt/hostedtoolcache/Python/3.10.14/x64/lib/python3.10/site-packages (from matplotlib<4.0.0,>=3.2.2->wfdb==4.0.0) (2.9.0.post0)
Requirement already satisfied: pytz>=2020.1 in /opt/hostedtoolcache/Python/3.10.14/x64/lib/python3.10/site-packages (from pandas<2.0.0,>=1.0.0->wfdb==4.0.0) (2024.1)
Requirement already satisfied: charset-normalizer<4,>=2 in /opt/hostedtoolcache/Python/3.10.14/x64/lib/python3.10/site-packages (from requests<3.0.0,>=2.8.1->wfdb==4.0.0) (3.3.2)
Requirement already satisfied: idna<4,>=2.5 in /opt/hostedtoolcache/Python/3.10.14/x64/lib/python3.10/site-packages (from requests<3.0.0,>=2.8.1->wfdb==4.0.0) (3.7)
Requirement already satisfied: urllib3<3,>=1.21.1 in /opt/hostedtoolcache/Python/3.10.14/x64/lib/python3.10/site-packages (from requests<3.0.0,>=2.8.1->wfdb==4.0.0) (2.2.2)
Requirement already satisfied: certifi>=2017.4.17 in /opt/hostedtoolcache/Python/3.10.14/x64/lib/python3.10/site-packages (from requests<3.0.0,>=2.8.1->wfdb==4.0.0) (2024.7.4)
Requirement already satisfied: cffi>=1.0 in /opt/hostedtoolcache/Python/3.10.14/x64/lib/python3.10/site-packages (from SoundFile<0.12.0,>=0.10.0->wfdb==4.0.0) (1.16.0)
Requirement already satisfied: pycparser in /opt/hostedtoolcache/Python/3.10.14/x64/lib/python3.10/site-packages (from cffi>=1.0->SoundFile<0.12.0,>=0.10.0->wfdb==4.0.0) (2.22)
Requirement already satisfied: six>=1.5 in /opt/hostedtoolcache/Python/3.10.14/x64/lib/python3.10/site-packages (from python-dateutil>=2.7->matplotlib<4.0.0,>=3.2.2->wfdb==4.0.0) (1.16.0)
Specify the settings for the MIMIC-IV database
# The name of the MIMIC IV Waveform Database on PhysioNet
database_name = 'mimic4wdb/0.1.0'
Provide a list of segments which meet the requirements for the study (NB: these are copied from the end of the Data Exploration Tutorial).
segment_names = ['83404654_0005', '82924339_0007']
segment_dirs = ['mimic4wdb/0.1.0/waves/p100/p10020306/83404654',
                'mimic4wdb/0.1.0/waves/p101/p10126957/82924339']
Specify a segment from which to extract data
rel_segment_n = 1
rel_segment_name = segment_names[rel_segment_n]
rel_segment_dir = segment_dirs[rel_segment_n]
print(f"Specified segment '{rel_segment_name}' in directory: '{rel_segment_dir}'")
Specified segment '82924339_0007' in directory: 'mimic4wdb/0.1.0/waves/p101/p10126957/82924339'
Extract one minute of data from this segment#
Specify the timings of the data to be extracted
# time since the start of the segment at which to begin extracting data
start_seconds = 20
n_seconds_to_load = 60
Find out the sampling frequency of the waveform data
segment_metadata = wfdb.rdheader(record_name=rel_segment_name,
                                 pn_dir=rel_segment_dir)

print(f"Metadata loaded from segment: {rel_segment_name}")
fs = round(segment_metadata.fs)
Metadata loaded from segment: 82924339_0007
Extract the specified data
sampfrom = fs * start_seconds
sampto = fs * (start_seconds + n_seconds_to_load)

segment_data = wfdb.rdrecord(record_name=rel_segment_name,
                             sampfrom=sampfrom,
                             sampto=sampto,
                             pn_dir=rel_segment_dir)

print(f"{n_seconds_to_load} seconds of data extracted from segment {rel_segment_name}")
60 seconds of data extracted from segment 82924339_0007
Plot the extracted signals#
Plot the extracted signals using the plot_wfdb function from the WFDB Toolbox.
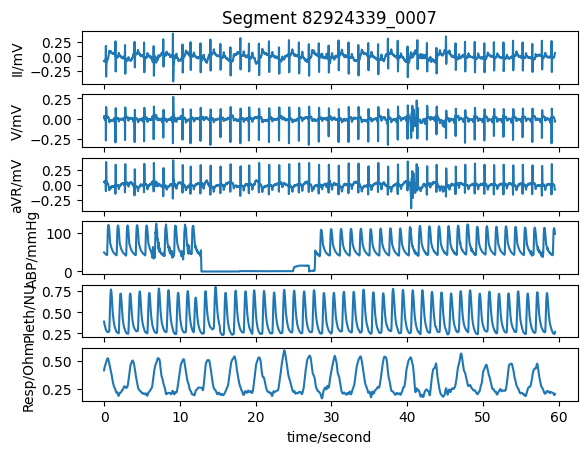
title_text = f"Segment {rel_segment_name}"
wfdb.plot_wfdb(record=segment_data,
               title=title_text,
               time_units='seconds')
Extract the PPG signal to loook at it more closely
for sig_no in range(0, len(segment_data.sig_name)):
    if "Pleth" in segment_data.sig_name[sig_no]:
        break

ppg = segment_data.p_signal[:, sig_no]
fs = segment_data.fs
print(f"Extracted the PPG signal from column {sig_no} of the matrix of waveform data.")
Extracted the PPG signal from column 4 of the matrix of waveform data.
Note: the name given to PPG signals in the database is 'Pleth'.
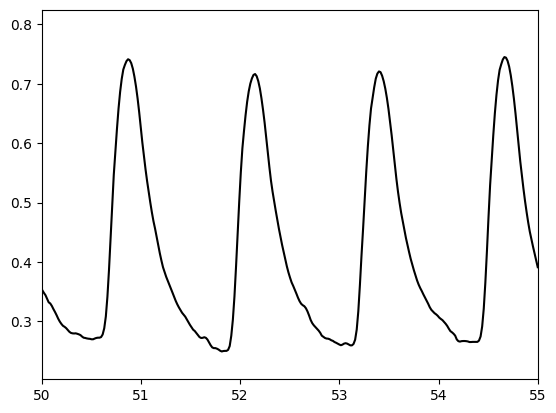
Plot to look at the shape of the PPG pulse wave more closely
from matplotlib import pyplot as plt
import numpy as np

t = np.arange(0, (len(ppg) / fs), 1.0 / fs)
plt.plot(t, ppg, color = 'black', label='PPG')
plt.xlim([50, 55])
(50.0, 55.0)
Compare this to pulse waves from the literature#
Compare the pulse waves above to the different shapes of pulse waves shown here:

Source: Charlton PH et al., ‘Assessing hemodynamics from the photoplethysmogram to gain insights into vascular age: a review from VascAgeNet’, https://doi.org/10.1152/ajpheart.00392.2021 (CC BY 4.0)
These pulse waves are the typical shapes for young (class 1) to old (class 4) subjects.
Question: How do these pulse waves compare to those extracted from the MIMIC Database? Which is most similar?