Pulse Wave Analysis#
In this tutorial we will learn how to extract features from PPG pulse waves.
Our objectives are to:
Detect several fiducial points on PPG pulse waves
Calculate pulse wave features from the fiducial points
Context: One approach to estimating BP from PPG signals consists of extracting features from PPG pulse waves, and then using these as inputs to BP estimation model. This tutorial covers the first of these steps: extracting features from PPG pulse waves.
Resource: You can read more about pulse wave analysis in Sections 3.2.2 and 3.2.3 of this book.
Setup#
These steps have been covered in previous tutorials, so we’ll just re-use the code here.
import sys
import numpy as np
import scipy.signal as sp

from matplotlib import pyplot as plt

!pip install wfdb==4.0.0
import wfdb
Requirement already satisfied: wfdb==4.0.0 in /opt/hostedtoolcache/Python/3.10.14/x64/lib/python3.10/site-packages (4.0.0)
Requirement already satisfied: SoundFile<0.12.0,>=0.10.0 in /opt/hostedtoolcache/Python/3.10.14/x64/lib/python3.10/site-packages (from wfdb==4.0.0) (0.11.0)
Requirement already satisfied: matplotlib<4.0.0,>=3.2.2 in /opt/hostedtoolcache/Python/3.10.14/x64/lib/python3.10/site-packages (from wfdb==4.0.0) (3.5.2)
Requirement already satisfied: numpy<2.0.0,>=1.10.1 in /opt/hostedtoolcache/Python/3.10.14/x64/lib/python3.10/site-packages (from wfdb==4.0.0) (1.26.4)
Requirement already satisfied: pandas<2.0.0,>=1.0.0 in /opt/hostedtoolcache/Python/3.10.14/x64/lib/python3.10/site-packages (from wfdb==4.0.0) (1.5.3)
Requirement already satisfied: requests<3.0.0,>=2.8.1 in /opt/hostedtoolcache/Python/3.10.14/x64/lib/python3.10/site-packages (from wfdb==4.0.0) (2.32.3)
Requirement already satisfied: scipy<2.0.0,>=1.0.0 in /opt/hostedtoolcache/Python/3.10.14/x64/lib/python3.10/site-packages (from wfdb==4.0.0) (1.14.0)
Requirement already satisfied: cycler>=0.10 in /opt/hostedtoolcache/Python/3.10.14/x64/lib/python3.10/site-packages (from matplotlib<4.0.0,>=3.2.2->wfdb==4.0.0) (0.12.1)
Requirement already satisfied: fonttools>=4.22.0 in /opt/hostedtoolcache/Python/3.10.14/x64/lib/python3.10/site-packages (from matplotlib<4.0.0,>=3.2.2->wfdb==4.0.0) (4.53.1)
Requirement already satisfied: kiwisolver>=1.0.1 in /opt/hostedtoolcache/Python/3.10.14/x64/lib/python3.10/site-packages (from matplotlib<4.0.0,>=3.2.2->wfdb==4.0.0) (1.4.5)
Requirement already satisfied: packaging>=20.0 in /opt/hostedtoolcache/Python/3.10.14/x64/lib/python3.10/site-packages (from matplotlib<4.0.0,>=3.2.2->wfdb==4.0.0) (24.1)
Requirement already satisfied: pillow>=6.2.0 in /opt/hostedtoolcache/Python/3.10.14/x64/lib/python3.10/site-packages (from matplotlib<4.0.0,>=3.2.2->wfdb==4.0.0) (10.4.0)
Requirement already satisfied: pyparsing>=2.2.1 in /opt/hostedtoolcache/Python/3.10.14/x64/lib/python3.10/site-packages (from matplotlib<4.0.0,>=3.2.2->wfdb==4.0.0) (3.1.2)
Requirement already satisfied: python-dateutil>=2.7 in /opt/hostedtoolcache/Python/3.10.14/x64/lib/python3.10/site-packages (from matplotlib<4.0.0,>=3.2.2->wfdb==4.0.0) (2.9.0.post0)
Requirement already satisfied: pytz>=2020.1 in /opt/hostedtoolcache/Python/3.10.14/x64/lib/python3.10/site-packages (from pandas<2.0.0,>=1.0.0->wfdb==4.0.0) (2024.1)
Requirement already satisfied: charset-normalizer<4,>=2 in /opt/hostedtoolcache/Python/3.10.14/x64/lib/python3.10/site-packages (from requests<3.0.0,>=2.8.1->wfdb==4.0.0) (3.3.2)
Requirement already satisfied: idna<4,>=2.5 in /opt/hostedtoolcache/Python/3.10.14/x64/lib/python3.10/site-packages (from requests<3.0.0,>=2.8.1->wfdb==4.0.0) (3.7)
Requirement already satisfied: urllib3<3,>=1.21.1 in /opt/hostedtoolcache/Python/3.10.14/x64/lib/python3.10/site-packages (from requests<3.0.0,>=2.8.1->wfdb==4.0.0) (2.2.2)
Requirement already satisfied: certifi>=2017.4.17 in /opt/hostedtoolcache/Python/3.10.14/x64/lib/python3.10/site-packages (from requests<3.0.0,>=2.8.1->wfdb==4.0.0) (2024.7.4)
Requirement already satisfied: cffi>=1.0 in /opt/hostedtoolcache/Python/3.10.14/x64/lib/python3.10/site-packages (from SoundFile<0.12.0,>=0.10.0->wfdb==4.0.0) (1.16.0)
Requirement already satisfied: pycparser in /opt/hostedtoolcache/Python/3.10.14/x64/lib/python3.10/site-packages (from cffi>=1.0->SoundFile<0.12.0,>=0.10.0->wfdb==4.0.0) (2.22)
Requirement already satisfied: six>=1.5 in /opt/hostedtoolcache/Python/3.10.14/x64/lib/python3.10/site-packages (from python-dateutil>=2.7->matplotlib<4.0.0,>=3.2.2->wfdb==4.0.0) (1.16.0)
# The name of the MIMIC-IV Waveform Database on PhysioNet
database_name = 'mimic4wdb/0.1.0'

# Segment for analysis
segment_names = ['83404654_0005', '82924339_0007', '84248019_0005', '82439920_0004', '82800131_0002', '84304393_0001', '89464742_0001', '88958796_0004', '88995377_0001', '85230771_0004', '86643930_0004', '81250824_0005', '87706224_0003', '83058614_0005', '82803505_0017', '88574629_0001', '87867111_0012', '84560969_0001', '87562386_0001', '88685937_0001', '86120311_0001', '89866183_0014', '89068160_0002', '86380383_0001', '85078610_0008', '87702634_0007', '84686667_0002', '84802706_0002', '81811182_0004', '84421559_0005', '88221516_0007', '80057524_0005', '84209926_0018', '83959636_0010', '89989722_0016', '89225487_0007', '84391267_0001', '80889556_0002', '85250558_0011', '84567505_0005', '85814172_0007', '88884866_0005', '80497954_0012', '80666640_0014', '84939605_0004', '82141753_0018', '86874920_0014', '84505262_0010', '86288257_0001', '89699401_0001', '88537698_0013', '83958172_0001']
segment_dirs = ['mimic4wdb/0.1.0/waves/p100/p10020306/83404654', 'mimic4wdb/0.1.0/waves/p101/p10126957/82924339', 'mimic4wdb/0.1.0/waves/p102/p10209410/84248019', 'mimic4wdb/0.1.0/waves/p109/p10952189/82439920', 'mimic4wdb/0.1.0/waves/p111/p11109975/82800131', 'mimic4wdb/0.1.0/waves/p113/p11392990/84304393', 'mimic4wdb/0.1.0/waves/p121/p12168037/89464742', 'mimic4wdb/0.1.0/waves/p121/p12173569/88958796', 'mimic4wdb/0.1.0/waves/p121/p12188288/88995377', 'mimic4wdb/0.1.0/waves/p128/p12872596/85230771', 'mimic4wdb/0.1.0/waves/p129/p12933208/86643930', 'mimic4wdb/0.1.0/waves/p130/p13016481/81250824', 'mimic4wdb/0.1.0/waves/p132/p13240081/87706224', 'mimic4wdb/0.1.0/waves/p136/p13624686/83058614', 'mimic4wdb/0.1.0/waves/p137/p13791821/82803505', 'mimic4wdb/0.1.0/waves/p141/p14191565/88574629', 'mimic4wdb/0.1.0/waves/p142/p14285792/87867111', 'mimic4wdb/0.1.0/waves/p143/p14356077/84560969', 'mimic4wdb/0.1.0/waves/p143/p14363499/87562386', 'mimic4wdb/0.1.0/waves/p146/p14695840/88685937', 'mimic4wdb/0.1.0/waves/p149/p14931547/86120311', 'mimic4wdb/0.1.0/waves/p151/p15174162/89866183', 'mimic4wdb/0.1.0/waves/p153/p15312343/89068160', 'mimic4wdb/0.1.0/waves/p153/p15342703/86380383', 'mimic4wdb/0.1.0/waves/p155/p15552902/85078610', 'mimic4wdb/0.1.0/waves/p156/p15649186/87702634', 'mimic4wdb/0.1.0/waves/p158/p15857793/84686667', 'mimic4wdb/0.1.0/waves/p158/p15865327/84802706', 'mimic4wdb/0.1.0/waves/p158/p15896656/81811182', 'mimic4wdb/0.1.0/waves/p159/p15920699/84421559', 'mimic4wdb/0.1.0/waves/p160/p16034243/88221516', 'mimic4wdb/0.1.0/waves/p165/p16566444/80057524', 'mimic4wdb/0.1.0/waves/p166/p16644640/84209926', 'mimic4wdb/0.1.0/waves/p167/p16709726/83959636', 'mimic4wdb/0.1.0/waves/p167/p16715341/89989722', 'mimic4wdb/0.1.0/waves/p168/p16818396/89225487', 'mimic4wdb/0.1.0/waves/p170/p17032851/84391267', 'mimic4wdb/0.1.0/waves/p172/p17229504/80889556', 'mimic4wdb/0.1.0/waves/p173/p17301721/85250558', 'mimic4wdb/0.1.0/waves/p173/p17325001/84567505', 'mimic4wdb/0.1.0/waves/p174/p17490822/85814172', 'mimic4wdb/0.1.0/waves/p177/p17738824/88884866', 'mimic4wdb/0.1.0/waves/p177/p17744715/80497954', 'mimic4wdb/0.1.0/waves/p179/p17957832/80666640', 'mimic4wdb/0.1.0/waves/p180/p18080257/84939605', 'mimic4wdb/0.1.0/waves/p181/p18109577/82141753', 'mimic4wdb/0.1.0/waves/p183/p18324626/86874920', 'mimic4wdb/0.1.0/waves/p187/p18742074/84505262', 'mimic4wdb/0.1.0/waves/p188/p18824975/86288257', 'mimic4wdb/0.1.0/waves/p191/p19126489/89699401', 'mimic4wdb/0.1.0/waves/p193/p19313794/88537698', 'mimic4wdb/0.1.0/waves/p196/p19619764/83958172']

# 3 and 8 are helpful
rel_segment_no = 3
rel_segment_name = segment_names[rel_segment_no]
rel_segment_dir = segment_dirs[rel_segment_no]
Extract one minute of PPG signals from this segment#
These steps have been covered in previous tutorials, so we’ll just re-use the code here.
# time since the start of the segment at which to begin extracting data
start_seconds = 100
n_seconds_to_load = 20

segment_metadata = wfdb.rdheader(record_name=rel_segment_name, pn_dir=rel_segment_dir)
print(f"Metadata loaded from segment: {rel_segment_name}")

fs = round(segment_metadata.fs)
sampfrom = fs*start_seconds
sampto = fs * (start_seconds + n_seconds_to_load)
segment_data = wfdb.rdrecord(record_name=rel_segment_name,
                             sampfrom=sampfrom,
                             sampto=sampto,
                             pn_dir=rel_segment_dir)

print("{} seconds of data extracted from: {}".format(n_seconds_to_load,
                                                     rel_segment_name))

ppg_col = []
for sig_no in range(0, len(segment_data.sig_name)):
    if "Pleth" in segment_data.sig_name[sig_no]:
        ppg_col = sig_no

ppg = segment_data.p_signal[:, ppg_col]
fs = segment_data.fs

print(f"Extracted the PPG signal from column {ppg_col} of the matrix of waveform data at {fs:.1f} Hz.")
Metadata loaded from segment: 82439920_0004
20 seconds of data extracted from: 82439920_0004
Extracted the PPG signal from column 6 of the matrix of waveform data at 62.5 Hz.
Filter the PPG signal#
These steps have been covered in previous tutorials, so we’ll just re-use the code here.
# package
import scipy.signal as sp

# filter cut-offs, hertz
lpf_cutoff = 0.7
hpf_cutoff = 10

# create filter
sos_filter = sp.butter(10, [lpf_cutoff, hpf_cutoff],
                       btype = 'bp',
                       analog = False,
                       output = 'sos',
                       fs = segment_data.fs)

w, h = sp.sosfreqz(sos_filter, 2000, fs = fs)

# filter PPG
ppg_filt = sp.sosfiltfilt(sos_filter, ppg)
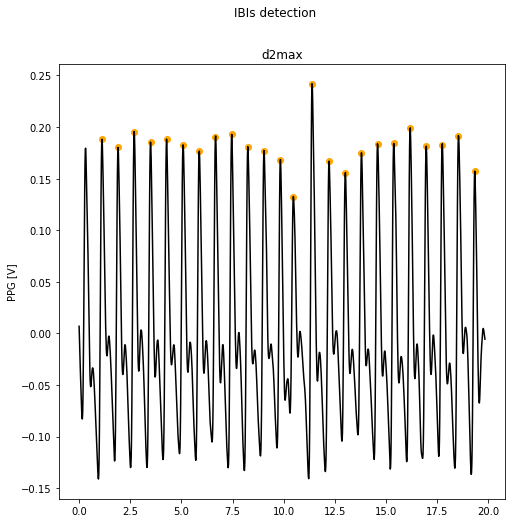
Detect beats in the PPG signal#
These steps have been covered in previous tutorials, so we’ll just re-use the code here.
Import the functions required to detect beats by running the cell containing the required functions at the end of this tutorial.
Detect beats
temp_fs = 125
alg = 'd2max'
ibis = pulse_detect(ppg_filt, temp_fs, 5, alg)

print(f"Detected {len(ibis)} beats in the PPG signal using the {alg} algorithm")
---------------------------------------------------------------------------
NameError                                 Traceback (most recent call last)
Cell In[5], line 3
      1 temp_fs = 125
      2 alg = 'd2max'
----> 3 ibis = pulse_detect(ppg_filt, temp_fs, 5, alg)
      5 print(f"Detected {len(ibis)} beats in the PPG signal using the {alg} algorithm")

NameError: name 'pulse_detect' is not defined
from matplotlib import pyplot as plt

fig, (ax1) = plt.subplots(1, 1,
                          sharex = False,
                          sharey = False,
                          figsize = (8,8))

fig.suptitle('IBIs detection')

t = np.arange(0,len(ppg_filt)/fs,1.0/fs)

ax1.plot(t, ppg_filt, color = 'black')
ax1.scatter(t[0] + ibis/fs, ppg_filt[ibis], color = 'orange', marker = 'o')
ax1.set_ylabel('PPG [V]')
ax1.set_title(alg)
Text(0.5, 1.0, 'd2max')
Identify fiducial points on pulse waves#
Import the functions required to detect beats by running the cell containing the required functions at the end of this tutorial.
Identify and visualise fiducial points
fidp = fiducial_points(ppg_filt, ibis, fs, vis = True)
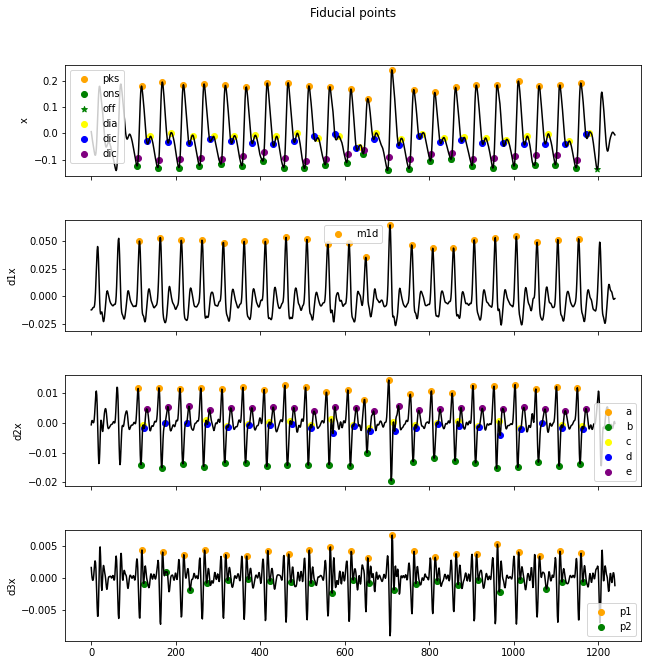
Note how the data are stored in the variable
fidp:
from pprint import pprint
pprint(fidp)
{'a2d': array([ 111,  160,  210,  259,  309,  359,  409,  458,  507,  556,  607,
        646,  704,  755,  805,  854,  903,  953, 1003, 1052, 1101, 1150]),
 'b2d': array([ 118,  167,  217,  266,  316,  365,  415,  464,  514,  563,  613,
        652,  710,  762,  811,  861,  909,  959, 1009, 1058, 1107, 1157]),
 'bmag2d': array([-1.20904914, -1.27434528, -1.18617494, -1.25106435, -1.17975974,
       -1.12447263, -1.3061457 , -1.12799448, -1.18401298, -1.36005387,
       -1.30485677, -1.26691507, -1.34436591, -1.35381951, -1.10175006,
       -1.27191046, -1.06948183, -1.23981112, -1.16142864, -1.15492695,
       -1.18547511, -1.15976755]),
 'c2d': array([ 123,  175,  226,  272,  322,  372,  421,  471,  519,  568,  619,
        657,  715,  767,  818,  867,  915,  964, 1015, 1067, 1113, 1162]),
 'cmag2d': array([-0.05526044,  0.00494062,  0.00941491,  0.07592429, -0.08726073,
       -0.04180734,  0.02715034,  0.05699838, -0.04395489,  0.12223351,
       -0.06261118, -0.23006774,  0.02414888, -0.05513966,  0.01296256,
        0.05157275, -0.0830145 ,  0.05575652, -0.14305034, -0.0055691 ,
       -0.05237448, -0.09997798]),
 'd2d': array([ 125,  175,  226,  275,  324,  373,  424,  474,  521,  572,  621,
        659,  718,  769,  820,  870,  917,  967, 1016, 1067, 1115, 1164]),
 'dia': array([ 140,  188,  241,  290,  338,  388,  438,  487,  536,  586,  633,
        673,  732,  783,  834,  883,  933,  982, 1031, 1081, 1131, 1178]),
 'dic': array([ 131,  181,  231,  280,  330,  380,  430,  479,  527,  576,  627,
        668,  727,  775,  825,  875,  925,  974, 1024, 1074, 1122, 1170]),
 'dmag2d': array([-0.15894175,  0.00494062,  0.00941491, -0.04033107, -0.12765008,
       -0.05821972, -0.05397396, -0.04063181, -0.13653246, -0.34360707,
       -0.0918036 , -0.3475212 , -0.19271096, -0.17903953, -0.03945182,
       -0.11730829, -0.11470973, -0.33752922, -0.15649059, -0.0055691 ,
       -0.12642557, -0.16601408]),
 'e2d': array([ 131,  181,  231,  280,  330,  380,  430,  479,  527,  576,  627,
        668,  727,  775,  825,  875,  925,  974, 1024, 1074, 1122, 1170]),
 'emag2d': array([0.40770919, 0.46482957, 0.48300358, 0.37208629, 0.44709264,
       0.42722916, 0.47149855, 0.41017449, 0.3312905 , 0.52228067,
       0.4666926 , 0.50848338, 0.40452346, 0.43939758, 0.42720655,
       0.51448892, 0.39003415, 0.39280966, 0.40374007, 0.40753314,
       0.33499539, 0.40420094]),
 'm1d': array([ 114,  163,  213,  262,  313,  362,  412,  461,  510,  560,  610,
        650,  707,  758,  808,  857,  906,  956, 1006, 1055, 1104, 1153]),
 'off': array([ 157,  207,  256,  307,  356,  406,  455,  504,  554,  604,  644,
        701,  752,  802,  851,  901,  950, 1000, 1049, 1098, 1147, 1197]),
 'ons': array([ 108,  157,  207,  256,  307,  356,  406,  455,  504,  554,  604,
        644,  701,  752,  802,  851,  901,  950, 1000, 1049, 1098, 1147]),
 'p1p': array([ 120,  169,  219,  268,  318,  368,  418,  467,  516,  566,  615,
        654,  712,  764,  814,  863,  912,  961, 1011, 1061, 1109, 1159]),
 'p2p': array([ 124,  178,  234,  273,  323,  372,  423,  472,  520,  570,  620,
        658,  716,  768,  819,  868,  916,  966, 1015, 1077, 1114, 1163]),
 'pks': array([ 119,  168,  218,  267,  317,  367,  416,  466,  515,  564,  614,
        654,  711,  763,  813,  862,  911,  961, 1011, 1060, 1108, 1158]),
 'tip': array([ 111,  160,  210,  259,  309,  359,  409,  458,  507,  556,  607,
        646,  704,  755,  805,  854,  903,  953, 1003, 1052, 1101, 1150])}
Calculate pulse wave features#
We will now calculate pulse wave features from the amplitudes and timings of the fiducial points on each pulse wave.

Source: Charlton PH, Photoplethysmogram (PPG) pulse wave indices, Wikimedia Commons, CC BY 4.0
_pulse_wave_indices.svg)
fidpis a dictionary consisting of several arrays (one per fiducial point), with each array containing the indices of that fiducial point for all of the pulse waves. For instance, we can inspect the indices of the dicrotic notches (dic) using:
print("Indices of dicrotic notches:")
print(fidp["dic"])
Indices of dicrotic notches:
[ 131  181  231  280  330  380  430  479  527  576  627  668  727  775
  825  875  925  974 1024 1074 1122 1170]
We’ll start off by calculating \(\Delta\)T, the time delay between systolic and diastolic peaks (
pksanddia):
delta_t = np.zeros(len(fidp["dia"]))
for beat_no in range(len(fidp["dia"])):
    delta_t[beat_no] = (fidp["dia"][beat_no]-fidp["pks"][beat_no])/fs
print("Values of Delta T:")
print(delta_t)
Values of Delta T:
[0.33614791 0.32014086 0.36816199 0.36816199 0.33614791 0.33614791
 0.35215495 0.33614791 0.33614791 0.35215495 0.30413382 0.30413382
 0.33614791 0.32014086 0.33614791 0.33614791 0.35215495 0.33614791
 0.32014086 0.33614791 0.36816199 0.32014086]
Explanation: See the figure above for an illustration of how Delta T is calculated.
Now we’ll calculate a second pulse wave feature, the aging index:
agi = np.zeros(len(fidp["dia"]))
for beat_no in range(len(fidp["dia"])):
    agi[beat_no] = (fidp["bmag2d"][beat_no]-fidp["cmag2d"][beat_no]-fidp["dmag2d"][beat_no]-fidp["emag2d"][beat_no])/fs
print("Values of Aging Index:")
print(agi)
Values of Aging Index:
[-0.02245078 -0.02799722 -0.02702002 -0.02655158 -0.02260101 -0.02323702
 -0.02802546 -0.02488352 -0.02136646 -0.02658707 -0.02588554 -0.01917339
 -0.02529637 -0.02495559 -0.02405006 -0.02754274 -0.02019755 -0.02162308
 -0.02025896 -0.02483208 -0.02147618 -0.02077676]
Question: Can you implement any more pulse wave features (e.g. 'CT')?
Beat Detection Functions#
Show code cell source
import scipy.signal as sp
import numpy as np
def pulse_detect(x,fs,w,alg):
"""
Description: Pulse detection and correction from pulsatile signals
Inputs: x, array with pulsatile signal [user defined units]
fs, sampling rate of signal [Hz]
w, window length for analysis [s]
alg, string with the name of the algorithm to apply ['heartpy','d2max','upslopes','delineator']
Outputs: ibis, location of cardiac cycles as detected by the selected algorithm [number of samples]
Algorithms: 1: HeartPy (van Gent et al, 2019, DOI: 10.1016/j.trf.2019.09.015)
2: 2nd derivative maxima (Elgendi et al, 2013, DOI: 10.1371/journal.pone.0076585)
3: Systolic upslopes (Arguello Prada and Serna Maldonado, 2018,
DOI: 10.1080/03091902.2019.1572237)
4: Delineator (Li et al, 2010, DOI: 10.1109/TBME.2005.855725)
Fiducial points: 1: Systolic peak (pks)
2: Onset, as the minimum before the systolic peak (ons)
3: Onset, using the tangent intersection method (ti)
4: Diastolic peak (dpk)
5: Maximum slope (m1d)
6: a point from second derivative PPG (a2d)
7: b point from second derivative PPG (b2d)
8: c point from second derivative PPG (c2d)
9: d point from second derivative PPG (d2d)
10: e point from second derivative PPG (e2d)
11: p1 from the third derivative PPG (p1)
12: p2 from the third derivative PPG (p2)
Libraries: NumPy (as np), SciPy (Signal, as sp), Matplotlib (PyPlot, as plt)
Version: 1.0 - June 2022
Developed by: Elisa Mejía-Mejía
City, University of London
"""
# Check selected algorithm
pos_alg = ['heartpy','d2max','upslopes','delineator']
if not(alg in pos_alg):
print('Unknown algorithm determined. Using D2max as default')
alg = 'd2max'
# Pre-processing of signal
x_d = sp.detrend(x)
sos = sp.butter(10, [0.5, 10], btype = 'bp', analog = False, output = 'sos', fs = fs)
x_f = sp.sosfiltfilt(sos, x_d)
# Peak detection in windows of length w
n_int = np.floor(len(x_f)/(w*fs))
for i in range(int(n_int)):
start = i*fs*w
stop = (i + 1)*fs*w - 1
# print('Start: ' + str(start) + ', stop: ' + str(stop) + ', fs: ' + str(fs))
aux = x_f[range(start,stop)]
if alg == 'heartpy':
locs = heartpy(aux,fs,40,180,5)
elif alg == 'd2max':
locs = d2max(aux,fs)
elif alg == 'upslopes':
locs = upslopes(aux)
elif alg == 'delineator':
locs = delineator(aux,fs)
locs = locs + start
if i == 0:
ibis = locs
else:
ibis = np.append(ibis,locs)
if n_int*fs*w != len(x_f):
start = stop + 1
stop = len(x_f)
aux = x_f[range(start,stop)]
if len(aux) > 20:
if alg == 'heartpy':
locs = heartpy(aux,fs,40,180,5)
elif alg == 'd2max':
locs = d2max(aux,fs)
elif alg == 'upslopes':
locs = upslopes(aux)
elif alg == 'delineator':
locs = delineator(aux,fs)
locs = locs + start
ibis = np.append(ibis,locs)
ind, = np.where(ibis <= len(x_f))
ibis = ibis[ind]
ibis = peak_correction(x,ibis,fs,20,5,[0.5, 1.5])
#fig = plt.figure()
#plt.plot(x)
#plt.plot(x_d)
#plt.plot(x_f)
#plt.scatter(ibis,x_f[ibis],marker = 'o',color = 'red')
#plt.scatter(ibis,x[ibis],marker = 'o',color = 'red')
return ibis
def peak_correction(x,locs,fs,t,stride,th_len):
"""
Correction of peaks detected from pulsatile signals
Inputs: x, pulsatile signal [user defined units]
locs, location of the detected interbeat intervals [number of samples]
fs, sampling rate [Hz]
t, duration of intervals for the correction [s]
stride, stride between consecutive intervals for the correction [s]
th_len, array with the percentage of lower and higher thresholds for comparing the duration of IBIs
[proportions]
Outputs: ibis, array with the corrected points related to the start of the inter-beat intervals [number of samples]
Developed by: Elisa Mejía Mejía
City, University of London
Version: 1.0 - June, 2022
"""
#fig = plt.figure()
#plt.plot(x)
#plt.scatter(locs,x[locs],marker = 'o',color = 'red', label = 'Original')
#plt.title('Peak correction')
# Correction of long and short IBIs
len_window = np.round(t*fs)
#print('Window length: ' + str(len_window))
first_i = 0
second_i = len_window - 1
while second_i < len(x):
ind1, = np.where(locs >= first_i)
ind2, = np.where(locs <= second_i)
ind = np.intersect1d(ind1, ind2)
win = locs[ind]
dif = np.diff(win)
#print('Indices: ' + str(ind) + ', locs: ' + str(locs[ind]) + ', dif: ' + str(dif))
th_dif = np.zeros(2)
th_dif[0] = th_len[0]*np.median(dif)
th_dif[1] = th_len[1]*np.median(dif)
th_amp = np.zeros(2)
th_amp[0] = 0.75*np.median(x[win])
th_amp[1] = 1.25*np.median(x[win])
#print('Length thresholds: ' + str(th_dif) + ', amplitude thresholds: ' + str(th_amp))
j = 0
while j < len(dif):
if dif[j] <= th_dif[0]:
if j == 0:
opt = np.append(win[j], win[j + 1])
else:
opt = np.append(win[j], win[j + 1]) - win[j - 1]
print('Optional: ' + str(opt))
dif_abs = np.abs(opt - np.median(dif))
min_val = np.min(dif_abs)
ind_min, = np.where(dif_abs == min_val)
print('Minimum: ' + str(min_val) + ', index: ' + str(ind_min))
if ind_min == 0:
print('Original window: ' + str(win), end = '')
win = np.delete(win, win[j + 1])
print(', modified window: ' + str(win))
else:
print('Original window: ' + str(win), end = '')
win = np.delete(win, win[j])
print(', modified window: ' + str(win))
dif = np.diff(win)
elif dif[j] >= th_dif[1]:
aux_x = x[win[j]:win[j + 1]]
locs_pks, _ = sp.find_peaks(aux_x)
#fig = plt.figure()
#plt.plot(aux_x)
#plt.scatter(locs_pks,aux_x[locs_pks],marker = 'o',color = 'red')
locs_pks = locs_pks + win[j]
ind1, = np.where(x[locs_pks] >= th_amp[0])
ind2, = np.where(x[locs_pks] <= th_amp[1])
ind = np.intersect1d(ind1, ind2)
locs_pks = locs_pks[ind]
#print('Locations: ' + str(locs_pks))
if len(locs_pks) != 0:
opt = locs_pks - win[j]
dif_abs = np.abs(opt - np.median(dif))
min_val = np.min(dif_abs)
ind_min, = np.where(dif_abs == min_val)
win = np.append(win, locs_pks[ind_min])
win = np.sort(win)
dif = np.diff(win)
j = j + 1
else:
opt = np.round(win[j] + np.median(dif))
if opt < win[j + 1]:
win = np.append(win, locs_pks[ind_min])
win = np.sort(win)
dif = np.diff(win)
j = j + 1
else:
j = j + 1
else:
j = j + 1
locs = np.append(win, locs)
locs = np.sort(locs)
first_i = first_i + stride*fs - 1
second_i = second_i + stride*fs - 1
dif = np.diff(locs)
dif = np.append(0, dif)
ind, = np.where(dif != 0)
locs = locs[ind]
#plt.scatter(locs,x[locs],marker = 'o',color = 'green', label = 'After length correction')
# Correction of points that are not peaks
i = 0
pre_loc = 0
while i < len(locs):
if locs[i] == 0:
locs = np.delete(locs, locs[i])
elif locs[i] == len(x):
locs = np.delete(locs, locs[i])
else:
#print('Previous: ' + str(x[locs[i] - 1]) + ', actual: ' + str(x[locs[i]]) + ', next: ' + str(x[locs[i] + 1]))
cond = (x[locs[i]] >= x[locs[i] - 1]) and (x[locs[i]] >= x[locs[i] + 1])
#print('Condition: ' + str(cond))
if cond:
i = i + 1
else:
if locs[i] == pre_loc:
i = i + 1
else:
if i == 0:
aux = x[0:locs[i + 1] - 1]
aux_loc = locs[i] - 1
aux_start = 0
elif i == len(locs) - 1:
aux = x[locs[i - 1]:len(x) - 1]
aux_loc = locs[i] - locs[i - 1]
aux_start = locs[i - 1]
else:
aux = x[locs[i - 1]:locs[i + 1]]
aux_loc = locs[i] - locs[i - 1]
aux_start = locs[i - 1]
#print('i ' + str(i) + ' out of ' + str(len(locs)) + ', aux length: ' + str(len(aux)) +
# ', location: ' + str(aux_loc))
#print('Locs i - 1: ' + str(locs[i - 1]) + ', locs i: ' + str(locs[i]) + ', locs i + 1: ' + str(locs[i + 1]))
pre = find_closest_peak(aux, aux_loc, 'backward')
pos = find_closest_peak(aux, aux_loc, 'forward')
#print('Previous: ' + str(pre) + ', next: ' + str(pos) + ', actual: ' + str(aux_loc))
ibi_pre = np.append(pre - 1, len(aux) - pre)
ibi_pos = np.append(pos - 1, len(aux) - pos)
ibi_act = np.append(aux_loc - 1, len(aux) - aux_loc)
#print('Previous IBIs: ' + str(ibi_pre) + ', next IBIs: ' + str(ibi_pos) +
# ', actual IBIs: ' + str(ibi_act))
dif_pre = np.abs(ibi_pre - np.mean(np.diff(locs)))
dif_pos = np.abs(ibi_pos - np.mean(np.diff(locs)))
dif_act = np.abs(ibi_act - np.mean(np.diff(locs)))
#print('Previous DIF: ' + str(dif_pre) + ', next DIF: ' + str(dif_pos) +
# ', actual DIF: ' + str(dif_act))
avgs = [np.mean(dif_pre), np.mean(dif_pos), np.mean(dif_act)]
min_avg = np.min(avgs)
ind, = np.where(min_avg == avgs)
#print('Averages: ' + str(avgs) + ', min index: ' + str(ind))
if len(ind) != 0:
ind = ind[0]
if ind == 0:
locs[i] = pre + aux_start - 1
elif ind == 1:
locs[i] = pos + aux_start - 1
elif ind == 2:
locs[i] = aux_loc + aux_start - 1
i = i + 1
#plt.scatter(locs,x[locs],marker = 'o',color = 'yellow', label = 'After not-peak correction')
# Correction of peaks according to amplitude
len_window = np.round(t*fs)
#print('Window length: ' + str(len_window))
keep = np.empty(0)
first_i = 0
second_i = len_window - 1
while second_i < len(x):
ind1, = np.where(locs >= first_i)
ind2, = np.where(locs <= second_i)
ind = np.intersect1d(ind1, ind2)
win = locs[ind]
if np.median(x[win]) > 0:
th_amp_low = 0.5*np.median(x[win])
th_amp_high = 3*np.median(x[win])
else:
th_amp_low = -3*np.median(x[win])
th_amp_high = 1.5*np.median(x[win])
ind1, = np.where(x[win] >= th_amp_low)
ind2, = np.where(x[win] <= th_amp_high)
aux_keep = np.intersect1d(ind1,ind2)
keep = np.append(keep, aux_keep)
first_i = second_i + 1
second_i = second_i + stride*fs - 1
if len(keep) != 0:
keep = np.unique(keep)
locs = locs[keep.astype(int)]
#plt.scatter(locs,x[locs],marker = 'o',color = 'purple', label = 'After amplitude correction')
#plt.legend()
return locs
def find_closest_peak(x, loc, dir_search):
"""
Finds the closest peak to the initial location in x
Inputs: x, signal of interest [user defined units]
loc, initial location [number of samples]
dir_search, direction of search ['backward','forward']
Outputs: pos, location of the first peak detected in specified direction [number of samples]
Developed by: Elisa Mejía Mejía
City, University of London
Version: 1.0 - June, 2022
"""
pos = -1
if dir_search == 'backward':
i = loc - 2
while i > 0:
if (x[i] > x[i - 1]) and (x[i] > x[i + 1]):
pos = i
i = 0
else:
i = i - 1
if pos == -1:
pos = loc
elif dir_search == 'forward':
i = loc + 1
while i < len(x) - 1:
if (x[i] > x[i - 1]) and (x[i] > x[i + 1]):
pos = i
i = len(x)
else:
i = i + 1
if pos == -1:
pos = loc
return pos
def seek_local(x, start, end):
val_min = x[start]
val_max = x[start]
ind_min = start
ind_max = start
for j in range(start, end):
if x[j] > val_max:
val_max = x[j]
ind_max = j
elif x[j] < val_min:
val_min = x[j]
ind_min = j
return val_min, ind_min, val_max, ind_max
def heartpy(x, fs, min_ihr, max_ihr, w):
"""
Detects inter-beat intervals using HeartPy
Citation: van Gent P, Farah H, van Nes N, van Arem B (2019) Heartpy: A novel heart rate algorithm
for the analysis of noisy signals. Transp Res Part F, vol. 66, pp. 368-378. DOI: 10.1016/j.trf.2019.09.015
Inputs: x, pulsatile signal [user defined units]
fs, sampling rate [Hz]
min_ihr, minimum value of instantaneous heart rate to be accepted [bpm]
max_ihr, maximum value of instantaneous heart rate to be accepted [bpm]
w, length of segments for correction of peaks [s]
Outputs: ibis, position of the starting points of inter-beat intervals [number of samples]
Developed by: Elisa Mejía Mejía
City, University of London
Version: 1.0 - June, 2022
"""
# Identification of peaks
is_roi = 0
n_rois = 0
pos_pks = np.empty(0).astype(int)
locs = np.empty(0).astype(int)
len_ma = int(np.round(0.75*fs))
#print(len_ma)
sig = np.append(x[0]*np.ones(len_ma), x)
sig = np.append(sig, x[-1]*np.ones(len_ma))
i = len_ma
while i < len(sig) - len_ma:
ma = np.mean(sig[i - len_ma:i + len_ma - 1])
#print(len(sig[i - len_ma:i + len_ma - 1]),ma)
# If it is the beginning of a new ROI:
if is_roi == 0 and sig[i] >= ma:
is_roi = 1
n_rois = n_rois + 1
#print('New ROI ---' + str(n_rois) + ' @ ' + str(i))
# If it is a peak:
if sig[i] >= sig[i - 1] and sig[i] >= sig[i + 1]:
pos_pks = np.append(pos_pks, int(i))
#print('Possible peaks: ' + str(pos_pks))
# If it is part of a ROI which is not over:
elif is_roi == 1 and sig[i] > ma:
#print('Actual ROI ---' + str(n_rois) + ' @ ' + str(i))
# If it is a peak:
if sig[i] >= sig[i - 1] and sig[i] >= sig[i + 1]:
pos_pks = np.append(pos_pks, int(i))
#print('Possible peaks: ' + str(pos_pks))
# If the ROI is over or the end of the signal has been reached:
elif is_roi == 1 and (sig[i] < ma or i == (len(sig) - len_ma)):
#print('End of ROI ---' + str(n_rois) + ' @ ' + str(i) + '. Pos pks: ' + str(pos_pks))
is_roi = 0 # Lowers flag
# If it is the end of the first ROI:
if n_rois == 1:
# If at least one peak has been found:
if len(pos_pks) != 0:
# Determines the location of the maximum peak:
max_pk = np.max(sig[pos_pks])
ind, = np.where(max_pk == np.max(sig[pos_pks]))
#print('First ROI: (1) Max Peak: ' + str(max_pk) + ', amplitudes: ' + str(sig[pos_pks]) +
# ', index: ' + str(int(ind)), ', pk_ind: ' + str(pos_pks[ind]))
# The maximum peak is added to the list:
locs = np.append(locs, pos_pks[ind])
#print('Locations: ' + str(locs))
# If no peak was found:
else:
# Counter for ROIs is reset to previous value:
n_rois = n_rois - 1
# If it is the end of the second ROI:
elif n_rois == 2:
# If at least one peak has been found:
if len(pos_pks) != 0:
# Measures instantantaneous HR of found peaks with respect to the previous peak:
ihr = 60/((pos_pks - locs[-1])/fs)
good_ihr, = np.where(ihr <= max_ihr and ihr >= min_ihr)
#print('Second ROI IHR check: (1) IHR: ' + str(ihr) + ', valid peaks: ' + str(good_ihr) +
# ', pos_pks before: ' + str(pos_pks) + ', pos_pks after: ' + str(pos_pks[good_ihr]))
pos_pks = pos_pks[good_ihr].astype(int)
# If at least one peak is between HR limits:
if len(pos_pks) != 0:
# Determines the location of the maximum peak:
max_pk = np.max(sig[pos_pks])
ind, = np.where(max_pk == np.max(sig[pos_pks]))
#print('Second ROI: (1) Max Peak: ' + str(max_pk) + ', amplitudes: ' + str(sig[pos_pks]) +
# ', index: ' + str(int(ind)), ', pk_ind: ' + str(pos_pks[ind]))
# The maximum peak is added to the list:
locs = np.append(locs, pos_pks[ind])
#print('Locations: ' + str(locs))
# If no peak was found:
else:
# Counter for ROIs is reset to previous value:
n_rois = n_rois - 1
# If it is the end of the any further ROI:
else:
# If at least one peak has been found:
if len(pos_pks) != 0:
# Measures instantantaneous HR of found peaks with respect to the previous peak:
ihr = 60/((pos_pks - locs[-1])/fs)
good_ihr, = np.where(ihr <= max_ihr and ihr >= min_ihr)
#print('Third ROI IHR check: (1) IHR: ' + str(ihr) + ', valid peaks: ' + str(good_ihr) +
# ', pos_pks before: ' + str(pos_pks) + ', pos_pks after: ' + str(pos_pks[good_ihr]))
pos_pks = pos_pks[good_ihr].astype(int)
# If at least one peak is between HR limits:
if len(pos_pks) != 0:
# Calculates SDNN with the possible peaks on the ROI:
sdnn = np.zeros(len(pos_pks))
for j in range(len(pos_pks)):
sdnn[j] = np.std(np.append(locs/fs, pos_pks[j]/fs))
# Determines the new peak as that one with the lowest SDNN:
min_pk = np.min(sdnn)
ind, = np.where(min_pk == np.min(sdnn))
#print('Third ROI: (1) Min SDNN Peak: ' + str(min_pk) + ', amplitudes: ' + str(sig[pos_pks]) +
# ', index: ' + str(int(ind)), ', pk_ind: ' + str(pos_pks[ind]))
locs = np.append(locs, pos_pks[ind])
#print('Locations: ' + str(locs))
# If no peak was found:
else:
# Counter for ROIs is reset to previous value:
n_rois = n_rois - 1
# Resets possible peaks for next ROI:
pos_pks = np.empty(0)
i = i + 1;
locs = locs - len_ma
# Correction of peaks
c_locs = np.empty(0)
n_int = np.floor(len(x)/(w*fs))
for i in range(int(n_int)):
ind1, = np.where(locs >= i*w*fs)
#print('Locs >= ' + str((i)*w*fs) + ': ' + str(locs[ind1]))
ind2, = np.where(locs < (i + 1)*w*fs)
#print('Locs < ' + str((i + 1)*w*fs) + ': ' + str(locs[ind2]))
ind = np.intersect1d(ind1, ind2)
#print('Larger and lower than locs: ' + str(locs[ind]))
int_locs = locs[ind]
if i == 0:
aux_ibis = np.diff(int_locs)
else:
ind, = np.where(locs >= i*w*fs)
last = locs[ind[0] - 1]
aux_ibis = np.diff(np.append(last, int_locs))
avg_ibis = np.mean(aux_ibis)
th = np.append((avg_ibis - 0.3*avg_ibis), (avg_ibis + 0.3*avg_ibis))
ind1, = np.where(aux_ibis > th[0])
#print('Ind1: ' + str(ind1))
ind2, = np.where(aux_ibis < th[1])
#print('Ind2: ' + str(ind2))
ind = np.intersect1d(ind1, ind2)
#print('Ind: ' + str(ind))
c_locs = np.append(c_locs, int_locs[ind]).astype(int)
print(c_locs)
#fig = plt.figure()
#plt.plot(x)
#plt.plot(sig)
#plt.scatter(locs,x[locs],marker = 'o',color = 'red')
#if len(c_locs) != 0:
#plt.scatter(c_locs,x[c_locs],marker = 'o',color = 'blue')
if len(c_locs) != 0:
ibis = c_locs
else:
ibis = locs
return ibis
def d2max(x, fs):
"""
Detects inter-beat intervals using D2Max
Citation: Elgendi M, Norton I, Brearley M, Abbott D, Schuurmans D (2013) Systolic Peak Detection in Acceleration
Photoplethysmograms Measured from Emergency Responders in Tropical Conditions. PLoS ONE, vol. 8, no. 10,
pp. e76585. DOI: 10.1371/journal.pone.0076585
Inputs: x, pulsatile signal [user defined units]
fs, sampling rate [Hz]
Outputs: ibis, position of the starting points of inter-beat intervals [number of samples]
Developed by: Elisa Mejía Mejía
City, University of London
Version: 1.0 - June, 2022
"""
# Bandpass filter
if len(x) < 4098:
z_fill = np.zeros(4098 - len(x) + 1)
x_z = np.append(x, z_fill)
sos = sp.butter(10, [0.5, 8], btype = 'bp', analog = False, output = 'sos', fs = fs)
x_f = sp.sosfiltfilt(sos, x_z)
# Signal clipping
ind, = np.where(x_f < 0)
x_c = x_f
x_c[ind] = 0
# Signal squaring
x_s = x_c**2
#plt.figure()
#plt.plot(x)
#plt.plot(x_z)
#plt.plot(x_f)
#plt.plot(x_c)
#plt.plot(x_s)
# Blocks of interest
w1 = (111e-3)*fs
w1 = int(2*np.floor(w1/2) + 1)
b = (1/w1)*np.ones(w1)
ma_pk = sp.filtfilt(b,1,x_s)
w2 = (667e-3)*fs
w2 = int(2*np.floor(w2/2) + 1)
b = (1/w2)*np.ones(w1)
ma_bpm = sp.filtfilt(b,1,x_s)
#plt.figure()
#plt.plot(x_s/np.max(x_s))
#plt.plot(ma_pk/np.max(ma_pk))
#plt.plot(ma_bpm/np.max(ma_bpm))
# Thresholding
alpha = 0.02*np.mean(ma_pk)
th_1 = ma_bpm + alpha
th_2 = w1
boi = (ma_pk > th_1).astype(int)
blocks_init, = np.where(np.diff(boi) > 0)
blocks_init = blocks_init + 1
blocks_end, = np.where(np.diff(boi) < 0)
blocks_end = blocks_end + 1
if blocks_init[0] > blocks_end[0]:
blocks_init = np.append(1, blocks_init)
if blocks_init[-1] > blocks_end[-1]:
blocks_end = np.append(blocks_end, len(x_s))
#print('Initial locs BOI: ' + str(blocks_init))
#print('Final locs BOI: ' + str(blocks_end))
#plt.figure()
#plt.plot(x_s[range(len(x))]/np.max(x_s))
#plt.plot(boi[range(len(x))])
# Search for peaks inside BOIs
len_blks = np.zeros(len(blocks_init))
ibis = np.zeros(len(blocks_init))
for i in range(len(blocks_init)):
ind, = np.where(blocks_end > blocks_init[i])
ind = ind[0]
len_blks[i] = blocks_end[ind] - blocks_init[i]
if len_blks[i] >= th_2:
aux = x[blocks_init[i]:blocks_end[ind]]
if len(aux) != 0:
max_val = np.max(aux)
max_ind, = np.where(max_val == aux)
ibis[i] = max_ind + blocks_init[i] - 1
ind, = np.where(len_blks < th_2)
if len(ind) != 0:
for i in range(len(ind)):
boi[blocks_init[i]:blocks_end[i]] = 0
ind, = np.where(ibis == 0)
ibis = (np.delete(ibis, ind)).astype(int)
#plt.plot(boi[range(len(x))])
#plt.figure()
#plt.plot(x)
#plt.scatter(ibis, x[ibis], marker = 'o',color = 'red')
return ibis
def upslopes(x):
"""
Detects inter-beat intervals using Upslopes
Citation: Arguello Prada EJ, Serna Maldonado RD (2018) A novel and low-complexity peak detection algorithm for
heart rate estimation from low-amplitude photoplethysmographic (PPG) signals. J Med Eng Technol, vol. 42,
no. 8, pp. 569-577. DOI: 10.1080/03091902.2019.1572237
Inputs: x, pulsatile signal [user defined units]
Outputs: ibis, position of the starting points of inter-beat intervals [number of samples]
Developed by: Elisa Mejía Mejía
City, University of London
Version: 1.0 - June, 2022
"""
# Peak detection
th = 6
pks = np.empty(0)
pos_pk = np.empty(0)
pos_pk_b = 0
n_pos_pk = 0
n_up = 0
for i in range(1, len(x)):
if x[i] > x[i - 1]:
n_up = n_up + 1
else:
if n_up > th:
pos_pk = np.append(pos_pk, i)
pos_pk_b = 1
n_pos_pk = n_pos_pk + 1
n_up_pre = n_up
else:
pos_pk = pos_pk.astype(int)
#print('Possible peaks: ' + str(pos_pk) + ', number of peaks: ' + str(n_pos_pk))
if pos_pk_b == 1:
if x[i - 1] > x[pos_pk[n_pos_pk - 1]]:
pos_pk[n_pos_pk - 1] = i - 1
else:
pks = np.append(pks, pos_pk[n_pos_pk - 1])
th = 0.6*n_up_pre
pos_pk_b = 0
n_up = 0
ibis = pks.astype(int)
#print(ibis)
#plt.figure()
#plt.plot(x)
#plt.scatter(ibis, x[ibis], marker = 'o',color = 'red')
return ibis
def delineator(x, fs):
"""
Detects inter-beat intervals using Delineator
Citation: Li BN, Dong MC, Vai MI (2010) On an automatic delineator for arterial blood pressure waveforms. Biomed
Signal Process Control, vol. 5, no. 1, pp. 76-81. DOI: 10.1016/j.bspc.2009.06.002
Inputs: x, pulsatile signal [user defined units]
fs, sampling rate [Hz]
Outputs: ibis, position of the starting points of inter-beat intervals [number of samples]
Developed by: Elisa Mejía Mejía
City, University of London
Version: 1.0 - June, 2022
"""
# Lowpass filter
od = 3
sos = sp.butter(od, 25, btype = 'low', analog = False, output = 'sos', fs = fs)
x_f = sp.sosfiltfilt(sos, x)
x_m = 1000*x_f
#plt.figure()
#plt.plot(x)
#plt.plot(x_f)
#plt.plot(x_m)
# Moving average
n = 5
b = (1/n)*np.ones(n)
x_ma = sp.filtfilt(b,1,x_m)
# Compute differentials
dif = np.diff(x_ma)
dif = 100*np.append(dif[0], dif)
dif_ma = sp.filtfilt(b,1,dif)
#plt.figure()
#plt.plot(x_ma)
#plt.plot(dif_ma)
# Average thresholds in original signal
x_len = len(x)
if x_len > 12*fs:
n = 10
elif x_len > 7*fs:
n = 5
elif x_len > 4*fs:
n = 2
else:
n = 1
#print(n)
max_min = np.empty(0)
if n > 1:
#plt.figure()
#plt.plot(x_ma)
n_int = np.floor(x_len/(n + 2))
#print('Length of intervals: ' + str(n_int))
for j in range(n):
# Searches for max and min in 1 s intervals
amp_min, ind_min, amp_max, ind_max = seek_local(x_ma, int(j*n_int), int(j*n_int + fs))
#plt.scatter(ind_min, amp_min, marker = 'o', color = 'red')
#plt.scatter(ind_max, amp_max, marker = 'o', color = 'green')
max_min = np.append(max_min, (amp_max - amp_min))
max_min_avg = np.mean(max_min)
#print('Local max and min: ' + str(max_min) + ', average amplitude: ' + str(max_min_avg))
else:
amp_min, ind_min , amp_max, ind_max = seek_local(x_ma, int(close_win), int(x_len))
#plt.figure()
#plt.plot(x_ma)
#plt.scatter(ind_min, amp_min, marker = 'o', color = 'red')
#plt.scatter(ind_max, amp_max, marker = 'o', color = 'green')
max_min_avg = amp_max - amp_min
#print('Local max and min: ' + str(max_min) + ', average amplitude: ' + str(max_min_avg))
max_min_lt = 0.4*max_min_avg
# Seek pulse beats by min-max method
step_win = 2*fs # Window length to look for peaks/onsets
close_win = np.floor(0.1*fs)
# Value of what is considered too close
pks = np.empty(0) # Location of peaks
ons = np.empty(0) # Location of onsets
dic = np.empty(0) # Location of dicrotic notches
pk_index = -1 # Number of peaks found
on_index = -1 # Number of onsets found
dn_index = -1 # Number of dicrotic notches found
i = int(close_win) # Initializes counter
while i < x_len: # Iterates through the signal
#print('i: ' + str(i))
amp_min = x_ma[i] # Gets the initial value for the minimum amplitude
amp_max = x_ma[i] # Gets the initial value for the maximum amplitude
ind = i # Initializes the temporal location of the index
aux_pks = i # Initializes the temporal location of the peak
aux_ons = i # Initializes the temporal location of the onset
# Iterates while ind is lower than the length of the signal
while ind < x_len - 1:
#print('Ind: ' + str(ind))
# Verifies if no peak has been found in 2 seconds
if (ind - i) > step_win:
#print('Peak not found in 2 s')
ind = i # Refreshes the temporal location of the index
max_min_avg = 0.6*max_min_avg # Refreshes the threshold for the amplitude
# Verifies if the threshold is lower than the lower limit
if max_min_avg <= max_min_lt:
max_min_avg = 2.5*max_min_lt # Refreshes the threshold
break
# Verifies if the location is a candidate peak
if (dif_ma[ind - 1]*dif_ma[ind + 1]) <= 0:
#print('There is a candidate peak')
# Determines initial and end points of a window to search for local peaks and onsets
if (ind + 5) < x_len:
i_stop = ind + 5
else:
i_stop = x_len - 1
if (ind - 5) >= 0:
i_start = ind - 5
else:
i_start = 0
# Checks for artifacts of saturated or signal loss
if (i_stop - ind) >= 5:
for j in range(ind, i_stop):
if dif_ma[j] != 0:
break
if j == i_stop:
#print('Artifact')
break
# Candidate onset
#print('Looking for candidate onsets...')
#plt.figure()
#plt.plot(x_ma)
if dif_ma[i_start] < 0:
if dif_ma[i_stop] > 0:
aux_min, ind_min, _, _ = seek_local(x_ma, int(i_start), int(i_stop))
#plt.scatter(ind_min, aux_min, marker = 'o', color = 'red')
if np.abs(ind_min - ind) <= 2:
amp_min = aux_min
aux_ons = ind_min
#print('Candidate onset: ' + str([ind_min, amp_min]))
# Candidate peak
#print('Looking for candidate peaks...')
if dif_ma[i_start] > 0:
if dif_ma[i_stop] < 0:
_, _, aux_max, ind_max = seek_local(x_ma, int(i_start), int(i_stop))
#plt.scatter(ind_max, aux_max, marker = 'o', color = 'green')
if np.abs(ind_max - ind) <= 2:
amp_max = aux_max
aux_pks = ind_max
#print('Candidate peak: ' + str([ind_max, amp_max]))
# Verifies if the amplitude of the pulse is larger than 0.4 times the mean value:
#print('Pulse amplitude: ' + str(amp_max - amp_min) + ', thresholds: ' +
# str([0.4*max_min_avg, 2*max_min_avg]))
if (amp_max - amp_min) > 0.4*max_min_avg:
#print('Expected amplitude of pulse')
# Verifies if the amplitude of the pulse is lower than 2 times the mean value:
if (amp_max - amp_min) < 2*max_min_avg:
#print('Expected duration of pulse')
if aux_pks > aux_ons:
#print('Refining onsets...')
# Refine onsets:
aux_min = x_ma[aux_ons]
temp_ons = aux_ons
for j in range(aux_pks, aux_ons + 1, -1):
if x_ma[j] < aux_min:
aux_min = x_ma[j]
temp_ons = j
amp_min = aux_min
aux_ons = temp_ons
# If there is at least one peak found before:
#print('Number of previous peaks: ' + str(pk_index + 1))
if pk_index >= 0:
#print('There were previous peaks')
#print('Duration of ons to peak interval: ' + str(aux_ons - pks[pk_index]) +
# ', threshold: ' + str([3*close_win, step_win]))
# If the duration of the pulse is too short:
if (aux_ons - pks[pk_index]) < 3*close_win:
#print('Too short interbeat interval')
ind = i
max_min_avg = 2.5*max_min_lt
break
# If the time difference between consecutive peaks is longer:
if (aux_pks - pks[pk_index]) > step_win:
#print('Too long interbeat interval')
pk_index = pk_index - 1
on_index = on_index - 1
#if dn_index > 0:
# dn_index = dn_index - 1
# If there are still peaks, add the new peak:
if pk_index >= 0:
#print('There are still previous peaks')
pk_index = pk_index + 1
on_index = on_index + 1
pks = np.append(pks, aux_pks)
ons = np.append(ons, aux_ons)
#print('Peaks: ' + str(pks))
#print('Onsets: ' + str(ons))
tf = ons[pk_index] - ons[pk_index - 1]
to = np.floor(fs/20)
tff = np.floor(0.1*tf)
if tff < to:
to = tff
to = pks[pk_index - 1] + to
te = np.floor(fs/20)
tff = np.floor(0.5*tf)
if tff < te:
te = tff
te = pks[pk_index - 1] + te
#tff = seek_dicrotic(dif_ma[to:te])
#if tff == 0:
# tff = te - pks[pk_index - 1]
# tff = np.floor(tff/3)
#dn_index = dn_index + 1
#dic[dn_index] = to + tff
ind = ind + close_win
break
# If it is the first peak:
if pk_index < 0:
#print('There were no previous peaks')
pk_index = pk_index + 1
on_index = on_index + 1
pks = np.append(pks, aux_pks)
ons = np.append(ons, aux_ons)
#print('Peaks: ' + str(pks))
#print('Onsets: ' + str(ons))
ind = ind + close_win
break
ind = ind + 1
i = int(ind + 1)
if len(pks) == 0:
return -1
else:
x_len = len(pks)
temp_p = np.empty(0)
for i in range(x_len):
temp_p = np.append(temp_p, pks[i] - od)
ttk = temp_p[0]
if ttk < 0:
temp_p[0] = 0
pks = temp_p
x_len = len(ons)
temp_o = np.empty(0)
for i in range(x_len):
temp_o = np.append(temp_o, ons[i] - od)
ttk = temp_o[0]
if ttk < 0:
temp_o[0] = 0
ons = temp_o
pks = pks + 5
ibis = pks.astype(int)
return ibis
Now return to the ‘Detect beats in the PPG signal’ step.
Fiducial Point Functions#
Show code cell source
def fiducial_points(x,pks,fs,vis):
    """
    Description: Pulse detection and correction from pulsatile signals
    Inputs:  x, array with pulsatile signal [user defined units]
             pks, array with the position of the peaks [number of samples]
             fs, sampling rate of signal [Hz]
             vis, visualisation option [True, False]
    Outputs: fidp, dictionary with the positions of several fiducial points for the cardiac cycles [number of samples]

    Fiducial points:  1: Systolic peak (pks)
                      2: Onset, as the minimum before the systolic peak (ons)
                      3: Onset, using the tangent intersection method (ti)
                      4: Diastolic peak (dpk)
                      5: Maximum slope (m1d)
                      6: a point from second derivative PPG (a2d)
                      7: b point from second derivative PPG (b2d)
                      8: c point from second derivative PPG (c2d)
                      9: d point from second derivative PPG (d2d)
                      10: e point from second derivative PPG (e2d)
                      11: p1 from the third derivative PPG (p1)
                      12: p2 from the third derivative PPG (p2)

    Libraries: NumPy (as np), SciPy (Signal, as sp), Matplotlib (PyPlot, as plt)

    Version: 1.0 - June 2022

    Developed by: Elisa Mejía-Mejía
                   City, University of London

    Edited by: Peter Charlton (see "Added by PC")

    """
    # First, second and third derivatives
    d1x = sp.savgol_filter(x, 9, 5, deriv = 1)
    d2x = sp.savgol_filter(x, 9, 5, deriv = 2)
    d3x = sp.savgol_filter(x, 9, 5, deriv = 3)

    #plt.figure()
    #plt.plot(x/np.max(x))
    #plt.plot(d1x/np.max(d1x))
    #plt.plot(d2x/np.max(d2x))
    #plt.plot(d3x/np.max(d3x))

    # Search in time series: Onsets between consecutive peaks
    ons = np.empty(0)
    for i in range(len(pks) - 1):
        start = pks[i]
        stop = pks[i + 1]
        ibi = x[start:stop]
        #plt.figure()
        #plt.plot(ibi, color = 'black')
        aux_ons, = np.where(ibi == np.min(ibi))
        ind_ons = aux_ons.astype(int)
        ons = np.append(ons, ind_ons + start)
        #plt.plot(ind_ons, ibi[ind_ons], marker = 'o', color = 'red')
    ons = ons.astype(int)
    #print('Onsets: ' + str(ons))
    #plt.figure()
    #plt.plot(x, color = 'black')
    #plt.scatter(pks, x[pks], marker = 'o', color = 'red')
    #plt.scatter(ons, x[ons], marker = 'o', color = 'blue')

    # Search in time series: Diastolic peak and dicrotic notch between consecutive onsets
    dia = np.empty(0)
    dic = np.empty(0)
    for i in range(len(ons) - 1):
        start = ons[i]
        stop = ons[i + 1]
        ind_pks, = np.intersect1d(np.where(pks < stop), np.where(pks > start))
        ind_pks = pks[ind_pks]
        ibi_portion = x[ind_pks:stop]
        ibi_2d_portion = d2x[ind_pks:stop]
        #plt.figure()
        #plt.plot(ibi_portion/np.max(ibi_portion))
        #plt.plot(ibi_2d_portion/np.max(ibi_2d_portion))
        aux_dic, _ = sp.find_peaks(ibi_2d_portion)
        aux_dic = aux_dic.astype(int)
        aux_dia, _ = sp.find_peaks(-ibi_2d_portion)
        aux_dia = aux_dia.astype(int)
        if len(aux_dic) != 0:
            ind_max, = np.where(ibi_2d_portion[aux_dic] == np.max(ibi_2d_portion[aux_dic]))
            aux_dic_max = aux_dic[ind_max]
            if len(aux_dia) != 0:
                nearest = aux_dia - aux_dic_max
                aux_dic = aux_dic_max
                dic = np.append(dic, (aux_dic + ind_pks).astype(int))
                #plt.scatter(aux_dic, ibi_portion[aux_dic]/np.max(ibi_portion), marker = 'o')
                ind_dia, = np.where(nearest > 0)
                aux_dia = aux_dia[ind_dia]
                nearest = nearest[ind_dia]
                if len(nearest) != 0:
                    ind_nearest, = np.where(nearest == np.min(nearest))
                    aux_dia = aux_dia[ind_nearest]
                    dia = np.append(dia, (aux_dia + ind_pks).astype(int))
                    #plt.scatter(aux_dia, ibi_portion[aux_dia]/np.max(ibi_portion), marker = 'o')
                    #break
            else:
                dic = np.append(dic, (aux_dic_max + ind_pks).astype(int))
                #plt.scatter(aux_dia, ibi_portion[aux_dia]/np.max(ibi_portion), marker = 'o')
    dia = dia.astype(int)
    dic = dic.astype(int)
    #plt.scatter(dia, x[dia], marker = 'o', color = 'orange')
    #plt.scatter(dic, x[dic], marker = 'o', color = 'green')

    # Search in D1: Maximum slope point
    m1d = np.empty(0)
    for i in range(len(ons) - 1):
        start = ons[i]
        stop = ons[i + 1]
        ind_pks, = np.intersect1d(np.where(pks < stop), np.where(pks > start))
        ind_pks = pks[ind_pks]
        ibi_portion = x[start:ind_pks]
        ibi_1d_portion = d1x[start:ind_pks]
        #plt.figure()
        #plt.plot(ibi_portion/np.max(ibi_portion))
        #plt.plot(ibi_1d_portion/np.max(ibi_1d_portion))
        aux_m1d, _ = sp.find_peaks(ibi_1d_portion)
        aux_m1d = aux_m1d.astype(int)
        if len(aux_m1d) != 0:
            ind_max, = np.where(ibi_1d_portion[aux_m1d] == np.max(ibi_1d_portion[aux_m1d]))
            aux_m1d_max = aux_m1d[ind_max]
            if len(aux_m1d_max) > 1:
                aux_m1d_max = aux_m1d_max[0]
            m1d = np.append(m1d, (aux_m1d_max + start).astype(int))
            #plt.scatter(aux_m1d, ibi_portion[aux_dic]/np.max(ibi_portion), marker = 'o')
            #break
    m1d = m1d.astype(int)
    #plt.scatter(m1d, x[m1d], marker = 'o', color = 'purple')

    # Search in time series: Tangent intersection points
    tip = np.empty(0)
    for i in range(len(ons) - 1):
        start = ons[i]
        stop = ons[i + 1]
        ibi_portion = x[start:stop]
        ibi_1d_portion = d1x[start:stop]
        ind_m1d, = np.intersect1d(np.where(m1d < stop), np.where(m1d > start))
        ind_m1d = m1d[ind_m1d] - start
        #plt.figure()
        #plt.plot(ibi_portion/np.max(ibi_portion))
        #plt.plot(ibi_1d_portion/np.max(ibi_1d_portion))
        #plt.scatter(ind_m1d, ibi_portion[ind_m1d]/np.max(ibi_portion), marker = 'o')
        #plt.scatter(ind_m1d, ibi_1d_portion[ind_m1d]/np.max(ibi_1d_portion), marker = 'o')
        aux_tip = np.round(((ibi_portion[0] - ibi_portion[ind_m1d])/ibi_1d_portion[ind_m1d]) + ind_m1d)
        aux_tip = aux_tip.astype(int)
        tip = np.append(tip, (aux_tip + start).astype(int))
        #plt.scatter(aux_tip, ibi_portion[aux_tip]/np.max(ibi_portion), marker = 'o')
        #break
    tip = tip.astype(int)
    #plt.scatter(tip, x[tip], marker = 'o', color = 'aqua')

    # Search in D2: A, B, C, D and E points
    a2d = np.empty(0)
    b2d = np.empty(0)
    c2d = np.empty(0)
    d2d = np.empty(0)
    e2d = np.empty(0)
    for i in range(len(ons) - 1):
        start = ons[i]
        stop = ons[i + 1]
        ibi_portion = x[start:stop]
        ibi_1d_portion = d1x[start:stop]
        ibi_2d_portion = d2x[start:stop]
        ind_m1d = np.intersect1d(np.where(m1d > start),np.where(m1d < stop))
        ind_m1d = m1d[ind_m1d]
        #plt.figure()
        #plt.plot(ibi_portion/np.max(ibi_portion))
        #plt.plot(ibi_1d_portion/np.max(ibi_1d_portion))
        #plt.plot(ibi_2d_portion/np.max(ibi_2d_portion))
        aux_m2d_pks, _ = sp.find_peaks(ibi_2d_portion)
        aux_m2d_ons, _ = sp.find_peaks(-ibi_2d_portion)
        # a point:
        ind_a, = np.where(ibi_2d_portion[aux_m2d_pks] == np.max(ibi_2d_portion[aux_m2d_pks]))
        ind_a = aux_m2d_pks[ind_a]
        if (ind_a < ind_m1d):
            a2d = np.append(a2d, ind_a + start)
            #plt.scatter(ind_a, ibi_2d_portion[ind_a]/np.max(ibi_2d_portion), marker = 'o')
            # b point:
            ind_b = np.where(ibi_2d_portion[aux_m2d_ons] == np.min(ibi_2d_portion[aux_m2d_ons]))
            ind_b = aux_m2d_ons[ind_b]
            if (ind_b > ind_a) and (ind_b < len(ibi_2d_portion)):
                b2d = np.append(b2d, ind_b + start)
                #plt.scatter(ind_b, ibi_2d_portion[ind_b]/np.max(ibi_2d_portion), marker = 'o')
        # e point:
        ind_e, = np.where(aux_m2d_pks > ind_m1d - start)
        aux_m2d_pks = aux_m2d_pks[ind_e]
        ind_e, = np.where(aux_m2d_pks < 0.6*len(ibi_2d_portion))
        ind_e = aux_m2d_pks[ind_e]
        if len(ind_e) >= 1:
            if len(ind_e) >= 2:
                ind_e = ind_e[1]
            e2d = np.append(e2d, ind_e + start)
            #plt.scatter(ind_e, ibi_2d_portion[ind_e]/np.max(ibi_2d_portion), marker = 'o')
            # c point:
            ind_c, = np.where(aux_m2d_pks < ind_e)
            if len(ind_c) != 0:
                ind_c_aux = aux_m2d_pks[ind_c]
                ind_c, = np.where(ibi_2d_portion[ind_c_aux] == np.max(ibi_2d_portion[ind_c_aux]))
                ind_c = ind_c_aux[ind_c]
                if len(ind_c) != 0:
                    c2d = np.append(c2d, ind_c + start)
                    #plt.scatter(ind_c, ibi_2d_portion[ind_c]/np.max(ibi_2d_portion), marker = 'o')
            else:
                aux_m1d_ons, _ = sp.find_peaks(-ibi_1d_portion)
                ind_c, = np.where(aux_m1d_ons < ind_e)
                ind_c_aux = aux_m1d_ons[ind_c]
                if len(ind_c) != 0:
                    ind_c, = np.where(ind_c_aux > ind_b)
                    ind_c = ind_c_aux[ind_c]
                    if len(ind_c) > 1:
                        ind_c = ind_c[0]
                    c2d = np.append(c2d, ind_c + start)
                    #plt.scatter(ind_c, ibi_2d_portion[ind_c]/np.max(ibi_2d_portion), marker = 'o')
            # d point:
            if len(ind_c) != 0:
                ind_d = np.intersect1d(np.where(aux_m2d_ons < ind_e), np.where(aux_m2d_ons > ind_c))
                if len(ind_d) != 0:
                    ind_d_aux = aux_m2d_ons[ind_d]
                    ind_d, = np.where(ibi_2d_portion[ind_d_aux] == np.min(ibi_2d_portion[ind_d_aux]))
                    ind_d = ind_d_aux[ind_d]
                    if len(ind_d) != 0:
                        d2d = np.append(d2d, ind_d + start)
                        #plt.scatter(ind_d, ibi_2d_portion[ind_d]/np.max(ibi_2d_portion), marker = 'o')
                else:
                    ind_d = ind_c
                    d2d = np.append(d2d, ind_d + start)
                    #plt.scatter(ind_d, ibi_2d_portion[ind_d]/np.max(ibi_2d_portion), marker = 'o')
    a2d = a2d.astype(int)
    b2d = b2d.astype(int)
    c2d = c2d.astype(int)
    d2d = d2d.astype(int)
    e2d = e2d.astype(int)
    #plt.figure()
    #plt.plot(d2x, color = 'black')
    #plt.scatter(a2d, d2x[a2d], marker = 'o', color = 'red')
    #plt.scatter(b2d, d2x[b2d], marker = 'o', color = 'blue')
    #plt.scatter(c2d, d2x[c2d], marker = 'o', color = 'green')
    #plt.scatter(d2d, d2x[d2d], marker = 'o', color = 'orange')
    #plt.scatter(e2d, d2x[e2d], marker = 'o', color = 'purple')

    # Search in D3: P1 and P2 points
    p1p = np.empty(0)
    p2p = np.empty(0)
    for i in range(len(ons) - 1):
        start = ons[i]
        stop = ons[i + 1]
        ibi_portion = x[start:stop]
        ibi_1d_portion = d1x[start:stop]
        ibi_2d_portion = d2x[start:stop]
        ibi_3d_portion = d3x[start:stop]
        ind_b = np.intersect1d(np.where(b2d > start),np.where(b2d < stop))
        ind_b = b2d[ind_b]
        ind_c = np.intersect1d(np.where(c2d > start),np.where(c2d < stop))
        ind_c = c2d[ind_c]
        ind_d = np.intersect1d(np.where(d2d > start),np.where(d2d < stop))
        ind_d = d2d[ind_d]
        ind_dic = np.intersect1d(np.where(dic > start),np.where(dic < stop))
        ind_dic = dic[ind_dic]
        #plt.figure()
        #plt.plot(ibi_portion/np.max(ibi_portion))
        #plt.plot(ibi_1d_portion/np.max(ibi_1d_portion))
        #plt.plot(ibi_2d_portion/np.max(ibi_2d_portion))
        #plt.plot(ibi_3d_portion/np.max(ibi_3d_portion))
        #plt.scatter(ind_b - start, ibi_3d_portion[ind_b - start]/np.max(ibi_3d_portion), marker = 'o')
        #plt.scatter(ind_c - start, ibi_3d_portion[ind_c - start]/np.max(ibi_3d_portion), marker = 'o')
        #plt.scatter(ind_d - start, ibi_3d_portion[ind_d - start]/np.max(ibi_3d_portion), marker = 'o')
        #plt.scatter(ind_dic - start, ibi_3d_portion[ind_dic - start]/np.max(ibi_3d_portion), marker = 'o')
        aux_p3d_pks, _ = sp.find_peaks(ibi_3d_portion)
        aux_p3d_ons, _ = sp.find_peaks(-ibi_3d_portion)
        # P1:
        if (len(aux_p3d_pks) != 0 and len(ind_b) != 0):
            ind_p1, = np.where(aux_p3d_pks > ind_b - start)
            if len(ind_p1) != 0:
                ind_p1 = aux_p3d_pks[ind_p1[0]]
                p1p = np.append(p1p, ind_p1 + start)
                #plt.scatter(ind_p1, ibi_3d_portion[ind_p1]/np.max(ibi_3d_portion), marker = 'o')
        # P2:
        if (len(aux_p3d_ons) != 0 and len(ind_c) != 0 and len(ind_d) != 0):
            if ind_c == ind_d:
                ind_p2, = np.where(aux_p3d_ons > ind_d - start)
                ind_p2 = aux_p3d_ons[ind_p2[0]]
            else:
                ind_p2, = np.where(aux_p3d_ons < ind_d - start)
                ind_p2 = aux_p3d_ons[ind_p2[-1]]
            if len(ind_dic) != 0:
                aux_x_pks, _ = sp.find_peaks(ibi_portion)
                if ind_p2 > ind_dic - start:
                    ind_between = np.intersect1d(np.where(aux_x_pks < ind_p2), np.where(aux_x_pks > ind_dic - start))
                else:
                    ind_between = np.intersect1d(np.where(aux_x_pks > ind_p2), np.where(aux_x_pks < ind_dic - start))
                if len(ind_between) != 0:
                    ind_p2 = aux_x_pks[ind_between[0]]
            p2p = np.append(p2p, ind_p2 + start)
            #plt.scatter(ind_p2, ibi_3d_portion[ind_p2]/np.max(ibi_3d_portion), marker = 'o')
    p1p = p1p.astype(int)
    p2p = p2p.astype(int)
    #plt.figure()
    #plt.plot(d3x, color = 'black')
    #plt.scatter(p1p, d3x[p1p], marker = 'o', color = 'green')
    #plt.scatter(p2p, d3x[p2p], marker = 'o', color = 'orange')

    # Added by PC: Magnitudes of second derivative points
    bmag2d = np.zeros(len(b2d))
    cmag2d = np.zeros(len(b2d))
    dmag2d = np.zeros(len(b2d))
    emag2d = np.zeros(len(b2d))
    for beat_no in range(0,len(d2d)):
        bmag2d[beat_no] = d2x[b2d[beat_no]]/d2x[a2d[beat_no]]
        cmag2d[beat_no] = d2x[c2d[beat_no]]/d2x[a2d[beat_no]]
        dmag2d[beat_no] = d2x[d2d[beat_no]]/d2x[a2d[beat_no]]
        emag2d[beat_no] = d2x[e2d[beat_no]]/d2x[a2d[beat_no]]

     # Added by PC: Refine the list of fiducial points to only include those corresponding to beats for which a full set of points is available
    off = ons[1:]
    ons = ons[:-1]
    if pks[0] < ons[0]:
        pks = pks[1:]
    if pks[-1] > off[-1]:
        pks = pks[:-1]

    # Visualise results
    if vis == True:
        fig, (ax1,ax2,ax3,ax4) = plt.subplots(4, 1, sharex = True, sharey = False, figsize=(10,10))
        fig.suptitle('Fiducial points')

        ax1.plot(x, color = 'black')
        ax1.scatter(pks, x[pks.astype(int)], color = 'orange', label = 'pks')
        ax1.scatter(ons, x[ons.astype(int)], color = 'green', label = 'ons')
        ax1.scatter(off, x[off.astype(int)], marker = '*', color = 'green', label = 'off')
        ax1.scatter(dia, x[dia.astype(int)], color = 'yellow', label = 'dia')
        ax1.scatter(dic, x[dic.astype(int)], color = 'blue', label = 'dic')
        ax1.scatter(tip, x[tip.astype(int)], color = 'purple', label = 'dic')
        ax1.legend()
        ax1.set_ylabel('x')

        ax2.plot(d1x, color = 'black')
        ax2.scatter(m1d, d1x[m1d.astype(int)], color = 'orange', label = 'm1d')
        ax2.legend()
        ax2.set_ylabel('d1x')

        ax3.plot(d2x, color = 'black')
        ax3.scatter(a2d, d2x[a2d.astype(int)], color = 'orange', label = 'a')
        ax3.scatter(b2d, d2x[b2d.astype(int)], color = 'green', label = 'b')
        ax3.scatter(c2d, d2x[c2d.astype(int)], color = 'yellow', label = 'c')
        ax3.scatter(d2d, d2x[d2d.astype(int)], color = 'blue', label = 'd')
        ax3.scatter(e2d, d2x[e2d.astype(int)], color = 'purple', label = 'e')
        ax3.legend()
        ax3.set_ylabel('d2x')

        ax4.plot(d3x, color = 'black')
        ax4.scatter(p1p, d3x[p1p.astype(int)], color = 'orange', label = 'p1')
        ax4.scatter(p2p, d3x[p2p.astype(int)], color = 'green', label = 'p2')
        ax4.legend()
        ax4.set_ylabel('d3x')

        plt.subplots_adjust(left = 0.1,
                            bottom = 0.1,
                            right = 0.9,
                            top = 0.9,
                            wspace = 0.4,
                            hspace = 0.4)

    # Creation of dictionary
    fidp = {'pks': pks.astype(int),
            'ons': ons.astype(int),
            'off': off.astype(int),  # Added by PC
            'tip': tip.astype(int),
            'dia': dia.astype(int),
            'dic': dic.astype(int),
            'm1d': m1d.astype(int),
            'a2d': a2d.astype(int),
            'b2d': b2d.astype(int),
            'c2d': c2d.astype(int),
            'd2d': d2d.astype(int),
            'e2d': e2d.astype(int),
            'bmag2d': bmag2d,
            'cmag2d': cmag2d,
            'dmag2d': dmag2d,
            'emag2d': emag2d,
            'p1p': p1p.astype(int),
            'p2p': p2p.astype(int)
            }

    return fidp