Differentiating the PPG signal#
In this tutorial we will learn how to differentiate physiological signals.
Our objectives are to:
Apply SciPy functions for differentiating signals.
View typical shapes of the first and second derivatives of PPG signals.
Context: Differentiating the PPG signal is a key step in identifying fiducial points on PPG pulse waves.
Setup#
These steps have been covered in previous tutorials, so we’ll just re-use the code here.
# Import packages
import sys
from pathlib import Path
!pip install wfdb==4.0.0
import wfdb
Requirement already satisfied: wfdb==4.0.0 in /opt/hostedtoolcache/Python/3.10.14/x64/lib/python3.10/site-packages (4.0.0)
Requirement already satisfied: SoundFile<0.12.0,>=0.10.0 in /opt/hostedtoolcache/Python/3.10.14/x64/lib/python3.10/site-packages (from wfdb==4.0.0) (0.11.0)
Requirement already satisfied: matplotlib<4.0.0,>=3.2.2 in /opt/hostedtoolcache/Python/3.10.14/x64/lib/python3.10/site-packages (from wfdb==4.0.0) (3.5.2)
Requirement already satisfied: numpy<2.0.0,>=1.10.1 in /opt/hostedtoolcache/Python/3.10.14/x64/lib/python3.10/site-packages (from wfdb==4.0.0) (1.26.4)
Requirement already satisfied: pandas<2.0.0,>=1.0.0 in /opt/hostedtoolcache/Python/3.10.14/x64/lib/python3.10/site-packages (from wfdb==4.0.0) (1.5.3)
Requirement already satisfied: requests<3.0.0,>=2.8.1 in /opt/hostedtoolcache/Python/3.10.14/x64/lib/python3.10/site-packages (from wfdb==4.0.0) (2.32.3)
Requirement already satisfied: scipy<2.0.0,>=1.0.0 in /opt/hostedtoolcache/Python/3.10.14/x64/lib/python3.10/site-packages (from wfdb==4.0.0) (1.14.0)
Requirement already satisfied: cycler>=0.10 in /opt/hostedtoolcache/Python/3.10.14/x64/lib/python3.10/site-packages (from matplotlib<4.0.0,>=3.2.2->wfdb==4.0.0) (0.12.1)
Requirement already satisfied: fonttools>=4.22.0 in /opt/hostedtoolcache/Python/3.10.14/x64/lib/python3.10/site-packages (from matplotlib<4.0.0,>=3.2.2->wfdb==4.0.0) (4.53.1)
Requirement already satisfied: kiwisolver>=1.0.1 in /opt/hostedtoolcache/Python/3.10.14/x64/lib/python3.10/site-packages (from matplotlib<4.0.0,>=3.2.2->wfdb==4.0.0) (1.4.5)
Requirement already satisfied: packaging>=20.0 in /opt/hostedtoolcache/Python/3.10.14/x64/lib/python3.10/site-packages (from matplotlib<4.0.0,>=3.2.2->wfdb==4.0.0) (24.1)
Requirement already satisfied: pillow>=6.2.0 in /opt/hostedtoolcache/Python/3.10.14/x64/lib/python3.10/site-packages (from matplotlib<4.0.0,>=3.2.2->wfdb==4.0.0) (10.4.0)
Requirement already satisfied: pyparsing>=2.2.1 in /opt/hostedtoolcache/Python/3.10.14/x64/lib/python3.10/site-packages (from matplotlib<4.0.0,>=3.2.2->wfdb==4.0.0) (3.1.2)
Requirement already satisfied: python-dateutil>=2.7 in /opt/hostedtoolcache/Python/3.10.14/x64/lib/python3.10/site-packages (from matplotlib<4.0.0,>=3.2.2->wfdb==4.0.0) (2.9.0.post0)
Requirement already satisfied: pytz>=2020.1 in /opt/hostedtoolcache/Python/3.10.14/x64/lib/python3.10/site-packages (from pandas<2.0.0,>=1.0.0->wfdb==4.0.0) (2024.1)
Requirement already satisfied: charset-normalizer<4,>=2 in /opt/hostedtoolcache/Python/3.10.14/x64/lib/python3.10/site-packages (from requests<3.0.0,>=2.8.1->wfdb==4.0.0) (3.3.2)
Requirement already satisfied: idna<4,>=2.5 in /opt/hostedtoolcache/Python/3.10.14/x64/lib/python3.10/site-packages (from requests<3.0.0,>=2.8.1->wfdb==4.0.0) (3.7)
Requirement already satisfied: urllib3<3,>=1.21.1 in /opt/hostedtoolcache/Python/3.10.14/x64/lib/python3.10/site-packages (from requests<3.0.0,>=2.8.1->wfdb==4.0.0) (2.2.2)
Requirement already satisfied: certifi>=2017.4.17 in /opt/hostedtoolcache/Python/3.10.14/x64/lib/python3.10/site-packages (from requests<3.0.0,>=2.8.1->wfdb==4.0.0) (2024.7.4)
Requirement already satisfied: cffi>=1.0 in /opt/hostedtoolcache/Python/3.10.14/x64/lib/python3.10/site-packages (from SoundFile<0.12.0,>=0.10.0->wfdb==4.0.0) (1.16.0)
Requirement already satisfied: pycparser in /opt/hostedtoolcache/Python/3.10.14/x64/lib/python3.10/site-packages (from cffi>=1.0->SoundFile<0.12.0,>=0.10.0->wfdb==4.0.0) (2.22)
Requirement already satisfied: six>=1.5 in /opt/hostedtoolcache/Python/3.10.14/x64/lib/python3.10/site-packages (from python-dateutil>=2.7->matplotlib<4.0.0,>=3.2.2->wfdb==4.0.0) (1.16.0)
# The name of the MIMIC-IV Waveform Database on PhysioNet
database_name = 'mimic4wdb/0.1.0'

# Segment for analysis
segment_names = ['83404654_0005', '82924339_0007', '84248019_0005', '82439920_0004', '82800131_0002', '84304393_0001', '89464742_0001', '88958796_0004', '88995377_0001', '85230771_0004', '86643930_0004', '81250824_0005', '87706224_0003', '83058614_0005', '82803505_0017', '88574629_0001', '87867111_0012', '84560969_0001', '87562386_0001', '88685937_0001', '86120311_0001', '89866183_0014', '89068160_0002', '86380383_0001', '85078610_0008', '87702634_0007', '84686667_0002', '84802706_0002', '81811182_0004', '84421559_0005', '88221516_0007', '80057524_0005', '84209926_0018', '83959636_0010', '89989722_0016', '89225487_0007', '84391267_0001', '80889556_0002', '85250558_0011', '84567505_0005', '85814172_0007', '88884866_0005', '80497954_0012', '80666640_0014', '84939605_0004', '82141753_0018', '86874920_0014', '84505262_0010', '86288257_0001', '89699401_0001', '88537698_0013', '83958172_0001']
segment_dirs = ['mimic4wdb/0.1.0/waves/p100/p10020306/83404654', 'mimic4wdb/0.1.0/waves/p101/p10126957/82924339', 'mimic4wdb/0.1.0/waves/p102/p10209410/84248019', 'mimic4wdb/0.1.0/waves/p109/p10952189/82439920', 'mimic4wdb/0.1.0/waves/p111/p11109975/82800131', 'mimic4wdb/0.1.0/waves/p113/p11392990/84304393', 'mimic4wdb/0.1.0/waves/p121/p12168037/89464742', 'mimic4wdb/0.1.0/waves/p121/p12173569/88958796', 'mimic4wdb/0.1.0/waves/p121/p12188288/88995377', 'mimic4wdb/0.1.0/waves/p128/p12872596/85230771', 'mimic4wdb/0.1.0/waves/p129/p12933208/86643930', 'mimic4wdb/0.1.0/waves/p130/p13016481/81250824', 'mimic4wdb/0.1.0/waves/p132/p13240081/87706224', 'mimic4wdb/0.1.0/waves/p136/p13624686/83058614', 'mimic4wdb/0.1.0/waves/p137/p13791821/82803505', 'mimic4wdb/0.1.0/waves/p141/p14191565/88574629', 'mimic4wdb/0.1.0/waves/p142/p14285792/87867111', 'mimic4wdb/0.1.0/waves/p143/p14356077/84560969', 'mimic4wdb/0.1.0/waves/p143/p14363499/87562386', 'mimic4wdb/0.1.0/waves/p146/p14695840/88685937', 'mimic4wdb/0.1.0/waves/p149/p14931547/86120311', 'mimic4wdb/0.1.0/waves/p151/p15174162/89866183', 'mimic4wdb/0.1.0/waves/p153/p15312343/89068160', 'mimic4wdb/0.1.0/waves/p153/p15342703/86380383', 'mimic4wdb/0.1.0/waves/p155/p15552902/85078610', 'mimic4wdb/0.1.0/waves/p156/p15649186/87702634', 'mimic4wdb/0.1.0/waves/p158/p15857793/84686667', 'mimic4wdb/0.1.0/waves/p158/p15865327/84802706', 'mimic4wdb/0.1.0/waves/p158/p15896656/81811182', 'mimic4wdb/0.1.0/waves/p159/p15920699/84421559', 'mimic4wdb/0.1.0/waves/p160/p16034243/88221516', 'mimic4wdb/0.1.0/waves/p165/p16566444/80057524', 'mimic4wdb/0.1.0/waves/p166/p16644640/84209926', 'mimic4wdb/0.1.0/waves/p167/p16709726/83959636', 'mimic4wdb/0.1.0/waves/p167/p16715341/89989722', 'mimic4wdb/0.1.0/waves/p168/p16818396/89225487', 'mimic4wdb/0.1.0/waves/p170/p17032851/84391267', 'mimic4wdb/0.1.0/waves/p172/p17229504/80889556', 'mimic4wdb/0.1.0/waves/p173/p17301721/85250558', 'mimic4wdb/0.1.0/waves/p173/p17325001/84567505', 'mimic4wdb/0.1.0/waves/p174/p17490822/85814172', 'mimic4wdb/0.1.0/waves/p177/p17738824/88884866', 'mimic4wdb/0.1.0/waves/p177/p17744715/80497954', 'mimic4wdb/0.1.0/waves/p179/p17957832/80666640', 'mimic4wdb/0.1.0/waves/p180/p18080257/84939605', 'mimic4wdb/0.1.0/waves/p181/p18109577/82141753', 'mimic4wdb/0.1.0/waves/p183/p18324626/86874920', 'mimic4wdb/0.1.0/waves/p187/p18742074/84505262', 'mimic4wdb/0.1.0/waves/p188/p18824975/86288257', 'mimic4wdb/0.1.0/waves/p191/p19126489/89699401', 'mimic4wdb/0.1.0/waves/p193/p19313794/88537698', 'mimic4wdb/0.1.0/waves/p196/p19619764/83958172']

# Segment 3 and 8 are helpful
rel_segment_n = 8
rel_segment_name = segment_names[rel_segment_n]
rel_segment_dir = segment_dirs[rel_segment_n]
Extract one minute of PPG signal from this segment#
These steps have been covered in previous tutorials, so we’ll just re-use the code here.
# time since the start of the segment at which to begin extracting data
start_seconds = 100
no_seconds_to_load = 5

segment_metadata = wfdb.rdheader(record_name=rel_segment_name,
                                 pn_dir=rel_segment_dir)
print(f"Metadata loaded from segment: {rel_segment_name}")

fs = round(segment_metadata.fs)
sampfrom = fs*start_seconds
sampto = fs*(start_seconds + no_seconds_to_load)

segment_data = wfdb.rdrecord(record_name=rel_segment_name,
                             sampfrom=sampfrom,
                             sampto=sampto,
                             pn_dir=rel_segment_dir)

print(f"{no_seconds_to_load} seconds of data extracted from: {rel_segment_name}")

for sig_no in range(0, len(segment_data.sig_name)):
    if "Pleth" in segment_data.sig_name[sig_no]:
        break

ppg = segment_data.p_signal[:,sig_no]
fs = segment_data.fs

print(f"Extracted the PPG signal from column {sig_no} of the matrix of waveform data.")
Metadata loaded from segment: 88995377_0001
5 seconds of data extracted from: 88995377_0001
Extracted the PPG signal from column 4 of the matrix of waveform data.
Filter the data#
These steps have been covered in previous tutorials, so we’ll just re-use the code here.
# package
import scipy.signal as sp

# filter cut-offs
lpf_cutoff = 0.7 # Hz
hpf_cutoff = 10 # Hz

# create filter
sos_ppg = sp.butter(10, [lpf_cutoff, hpf_cutoff],
                    btype = 'bp',
                    analog = False,
                    output = 'sos',
                    fs = segment_data.fs)

w, h = sp.sosfreqz(sos_ppg, 2000, fs = fs)

# filter PPG
ppg_filt = sp.sosfiltfilt(sos_ppg, ppg)
Import the packages required to plot the signal: matplotlib which is used to create plots, and NumPy which is used to create a time vector in this example.
from matplotlib import pyplot as plt
import numpy as np
Plot the original and the filtered PPG signal
fig, ax = plt.subplots()
t = np.arange(0, len(ppg_filt)) / segment_data.fs

ax.plot(t, ppg,
        linewidth=2.0,
        label = "original PPG")

ax.plot(t, ppg_filt,
        linewidth=2.0,
        label = "filtered PPG")

ax.set(xlim=(0, no_seconds_to_load))
plt.xlabel('time (s)')
plt.ylabel('PPG')

plt.legend()
plt.show()
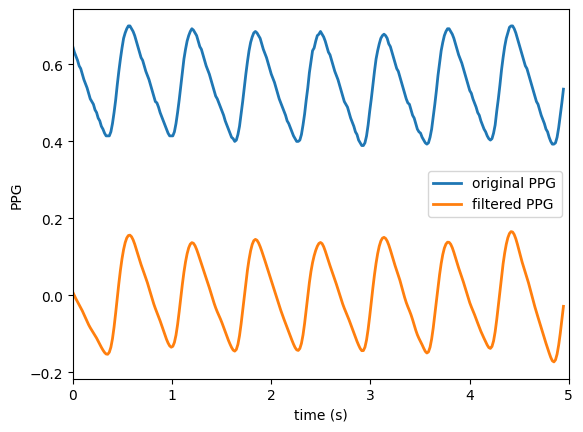
We will use the filtered signal instead of the original PPG from now on.
Differentiate the PPG signal#
Differentiate it once and twice using the Savitzky-Golay filtering function in SciPy
# Calculate first derivative
d1ppg = sp.savgol_filter(ppg_filt, 9, 5, deriv=1)

# Calculate second derivative
d2ppg = sp.savgol_filter(ppg_filt, 9, 5, deriv=2)
Resource: Savitzky-Golay filtering, which is used here to calculate derivatives, is described in this article.
Question: Can you summarise how Savitzky-Golay filtering works? What are its advantages in physiological signal processing?
Plot the PPG and its derivatives#
from matplotlib import pyplot as plt
import numpy as np
t = np.arange(0, len(ppg_filt))/segment_data.fs

fig, (ax1,ax2,ax3) = plt.subplots(3, 1, sharex = True, sharey = False)
ax1.plot(t, ppg_filt)
ax1.set(xlabel = '', ylabel = 'PPG')

plt.suptitle('The PPG signal and its first and second derivatives')

ax2.plot(t, d1ppg)
ax2.set(xlabel = '',
        ylabel = 'PPG\'')

ax3.plot(t, d2ppg)
ax3.set(xlabel = 'Time (s)',
        ylabel = 'PPG\'\'')

plt.show()
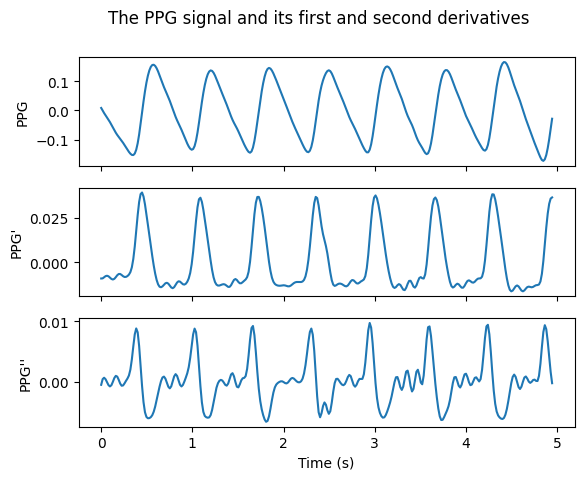
Question: How would the derivatives have looked different if the PPG signal hadn't been filtered before differentiation?
Hint: In the differentiation step above, try replacing 'ppg_filt' with 'ppg'.
Question: How would the derivatives have been different if the PPG signal had been filtered using different co-efficients?
Hint: Above, try replacing the relatively wide band-pass frequencies '[0.7, 10]' with '[0.8, 3]'.
Consider: Which band-pass frequencies would be most suitable for pulse wave analysis? How about heart rate estimation?
Comparison with typical PPG pulse wave#
The figure below shows a typical PPG pulse wave recorded from a young, healthy subject.

Source: Charlton PH, Photoplethysmogram (PPG) pulse wave fiducial points, Wikimedia Commons (CC BY 4.0).
_pulse_wave_fiducial_points.svg)
Question: How does this pulse wave shape and derivatives compare to the shape of those obtained from MIMIC data above? What might explain the differences?
Extension: Try using 'rel_segment_n=3' above (i.e. analysing segment '82439920_0004'). How do the pulse waves in this signal compare? What might that tell us about this patient?
Further reading: this article provides further information on how age affects the shape of the PPG's second derivative.