Filtering Signals#
In this tutorial we will practice filtering MIMIC waveform signals.
Our objectives are to:
Filter signals using the SciPy signal processing package.
Understand how to interpret the amplitude-response of a filter.
Gain experience in filtering PPG signals.
Context: Filtering is used to eliminate noise from physiological signals. For instance, ECG signals can contain mains frequency noise due to electrical interference. Ideally, a filter would attenuate unwanted frequency content in a signal whilst retaining the physiological frequency content.
Extension: If you've not seen it before, then have a look at the SciPy signal processing package. How might it be helpful for processing PPG signals?
Setup#
The following steps have been covered in previous tutorials. We’ll just re-use the previous code here.
# Packages
import sys
from pathlib import Path
!pip install wfdb==4.0.0
import wfdb

# The name of the MIMIC IV Waveform Database on Physionet
database_name = 'mimic4wdb/0.1.0'

# Segment for analysis
segment_names = ['83404654_0005',
                 '82924339_0007']

segment_dirs = ['mimic4wdb/0.1.0/waves/p100/p10020306/83404654',
                'mimic4wdb/0.1.0/waves/p101/p10126957/82924339']

rel_segment_n = 0
rel_segment_name = segment_names[rel_segment_n]
rel_segment_dir = segment_dirs[rel_segment_n]
Requirement already satisfied: wfdb==4.0.0 in /opt/hostedtoolcache/Python/3.10.14/x64/lib/python3.10/site-packages (4.0.0)
Requirement already satisfied: SoundFile<0.12.0,>=0.10.0 in /opt/hostedtoolcache/Python/3.10.14/x64/lib/python3.10/site-packages (from wfdb==4.0.0) (0.11.0)
Requirement already satisfied: matplotlib<4.0.0,>=3.2.2 in /opt/hostedtoolcache/Python/3.10.14/x64/lib/python3.10/site-packages (from wfdb==4.0.0) (3.5.2)
Requirement already satisfied: numpy<2.0.0,>=1.10.1 in /opt/hostedtoolcache/Python/3.10.14/x64/lib/python3.10/site-packages (from wfdb==4.0.0) (1.26.4)
Requirement already satisfied: pandas<2.0.0,>=1.0.0 in /opt/hostedtoolcache/Python/3.10.14/x64/lib/python3.10/site-packages (from wfdb==4.0.0) (1.5.3)
Requirement already satisfied: requests<3.0.0,>=2.8.1 in /opt/hostedtoolcache/Python/3.10.14/x64/lib/python3.10/site-packages (from wfdb==4.0.0) (2.32.3)
Requirement already satisfied: scipy<2.0.0,>=1.0.0 in /opt/hostedtoolcache/Python/3.10.14/x64/lib/python3.10/site-packages (from wfdb==4.0.0) (1.14.0)
Requirement already satisfied: cycler>=0.10 in /opt/hostedtoolcache/Python/3.10.14/x64/lib/python3.10/site-packages (from matplotlib<4.0.0,>=3.2.2->wfdb==4.0.0) (0.12.1)
Requirement already satisfied: fonttools>=4.22.0 in /opt/hostedtoolcache/Python/3.10.14/x64/lib/python3.10/site-packages (from matplotlib<4.0.0,>=3.2.2->wfdb==4.0.0) (4.53.1)
Requirement already satisfied: kiwisolver>=1.0.1 in /opt/hostedtoolcache/Python/3.10.14/x64/lib/python3.10/site-packages (from matplotlib<4.0.0,>=3.2.2->wfdb==4.0.0) (1.4.5)
Requirement already satisfied: packaging>=20.0 in /opt/hostedtoolcache/Python/3.10.14/x64/lib/python3.10/site-packages (from matplotlib<4.0.0,>=3.2.2->wfdb==4.0.0) (24.1)
Requirement already satisfied: pillow>=6.2.0 in /opt/hostedtoolcache/Python/3.10.14/x64/lib/python3.10/site-packages (from matplotlib<4.0.0,>=3.2.2->wfdb==4.0.0) (10.4.0)
Requirement already satisfied: pyparsing>=2.2.1 in /opt/hostedtoolcache/Python/3.10.14/x64/lib/python3.10/site-packages (from matplotlib<4.0.0,>=3.2.2->wfdb==4.0.0) (3.1.2)
Requirement already satisfied: python-dateutil>=2.7 in /opt/hostedtoolcache/Python/3.10.14/x64/lib/python3.10/site-packages (from matplotlib<4.0.0,>=3.2.2->wfdb==4.0.0) (2.9.0.post0)
Requirement already satisfied: pytz>=2020.1 in /opt/hostedtoolcache/Python/3.10.14/x64/lib/python3.10/site-packages (from pandas<2.0.0,>=1.0.0->wfdb==4.0.0) (2024.1)
Requirement already satisfied: charset-normalizer<4,>=2 in /opt/hostedtoolcache/Python/3.10.14/x64/lib/python3.10/site-packages (from requests<3.0.0,>=2.8.1->wfdb==4.0.0) (3.3.2)
Requirement already satisfied: idna<4,>=2.5 in /opt/hostedtoolcache/Python/3.10.14/x64/lib/python3.10/site-packages (from requests<3.0.0,>=2.8.1->wfdb==4.0.0) (3.7)
Requirement already satisfied: urllib3<3,>=1.21.1 in /opt/hostedtoolcache/Python/3.10.14/x64/lib/python3.10/site-packages (from requests<3.0.0,>=2.8.1->wfdb==4.0.0) (2.2.2)
Requirement already satisfied: certifi>=2017.4.17 in /opt/hostedtoolcache/Python/3.10.14/x64/lib/python3.10/site-packages (from requests<3.0.0,>=2.8.1->wfdb==4.0.0) (2024.7.4)
Requirement already satisfied: cffi>=1.0 in /opt/hostedtoolcache/Python/3.10.14/x64/lib/python3.10/site-packages (from SoundFile<0.12.0,>=0.10.0->wfdb==4.0.0) (1.16.0)
Requirement already satisfied: pycparser in /opt/hostedtoolcache/Python/3.10.14/x64/lib/python3.10/site-packages (from cffi>=1.0->SoundFile<0.12.0,>=0.10.0->wfdb==4.0.0) (2.22)
Requirement already satisfied: six>=1.5 in /opt/hostedtoolcache/Python/3.10.14/x64/lib/python3.10/site-packages (from python-dateutil>=2.7->matplotlib<4.0.0,>=3.2.2->wfdb==4.0.0) (1.16.0)
Extract one minute of PPG signal from this segment#
These steps have been covered in previous tutorials, so we’ll just re-use the code here.
# time since the start of the segment at which to begin extracting data
start_seconds = 20
n_seconds_to_load = 60

segment_metadata = wfdb.rdheader(record_name=rel_segment_name, pn_dir=rel_segment_dir)
print(f"Metadata loaded from segment: {rel_segment_name}")

fs = round(segment_metadata.fs)
sampfrom = fs*start_seconds
sampto = fs*(start_seconds + n_seconds_to_load)

segment_data = wfdb.rdrecord(record_name=rel_segment_name,
                             sampfrom=sampfrom,
                             sampto=sampto,
                             pn_dir=rel_segment_dir)

print(f"{n_seconds_to_load} seconds of data extracted from: {rel_segment_name}")

for sig_no in range(0, len(segment_data.sig_name)):
    if "Pleth" in segment_data.sig_name[sig_no]:
        break

ppg = segment_data.p_signal[:,sig_no]
fs = segment_data.fs
print(f"Extracted the PPG signal from column {sig_no} of the matrix of waveform data.")
Metadata loaded from segment: 83404654_0005
60 seconds of data extracted from: 83404654_0005
Extracted the PPG signal from column 4 of the matrix of waveform data.
Create a filter#
Import the SciPy signal processing package, which contains functions for filtering and differentiating.
import scipy.signal as sp
Specify the high- and low-pass filter cut-offs
# Specify cutoff in Hertz
lpf_cutoff = 0.7
hpf_cutoff = 10
Create a Butterworth filter using the butter function
sos_ppg = sp.butter(10,
                    [lpf_cutoff, hpf_cutoff],
                    btype = 'bp',
                    analog = False,
                    output = 'sos',
                    fs = segment_data.fs)

w, h = sp.sosfreqz(sos_ppg,
                   2000,
                   fs = fs)
Plot filter characteristics
from matplotlib import pyplot as plt
import numpy as np

fig, ax = plt.subplots()

ax.plot(w, 20 * np.log10(np.maximum(abs(h), 1e-5)))

ax.set_title('Butterworth bandpass filter frequency response')
ax.set_xlabel('Frequency [Hz]')
ax.set_ylabel('Amplitude [dB]')
ax.axis((0, 20, -100, 10))
ax.grid(which='both',
        axis='both')
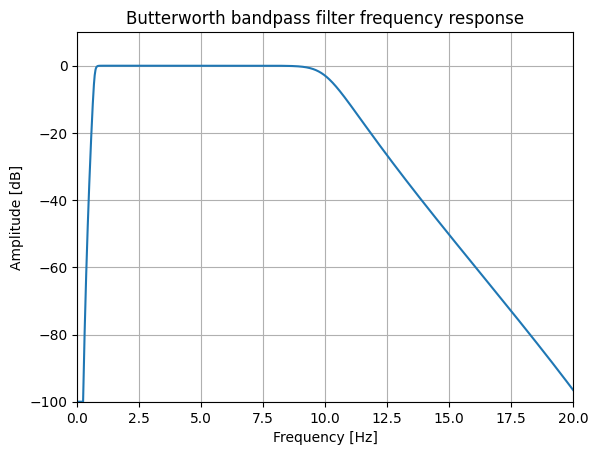
Question: What does this plot tell us about the filter characteristics? What types of noise does the filter attenuate?
Explanation: This function generates the co-efficients for a Butterworth filter. The filter-type is specified as 'bp' - a bandpass filtter. The filter frequencies are specified in Hz (because the sampling frequency, fs, has also been specified): a high-pass frequency of 0.7 Hz, and a low-pass frequency of 10 Hz.
Extension 1: How could we re-design the filter to retain frequency content of up to 20 Hz, but eliminate mains frequencies?
Extension 2: What would be appropriate cut-off frequencies when using the PPG for different purposes, e.g. heart rate monitoring, or blood pressure estimation? See this book chapter (Sections 2.2.4 to 2.2.5 on Sampling Frequency and Bandwidth) for details.
Filter the PPG signal#
Filter the PPG signal in preparation for differentiation.
ppg_filt = sp.sosfiltfilt(sos_ppg, ppg)
Plot original and filtered PPG signals
fig, ax = plt.subplots()
t = np.arange(0, len(ppg_filt))/segment_data.fs

ax.plot(t, ppg,
        linewidth=2.0,
        color = 'blue',
        label = "original PPG")

ax.plot(t, ppg_filt,
        linewidth=2.0,
        color = 'red',
        label = "filtered PPG")

ax.set(xlim=(0, n_seconds_to_load))
plt.xlabel('time (s)')
plt.ylabel('PPG')
plt.xlim([50, 60])

plt.legend()
plt.show()
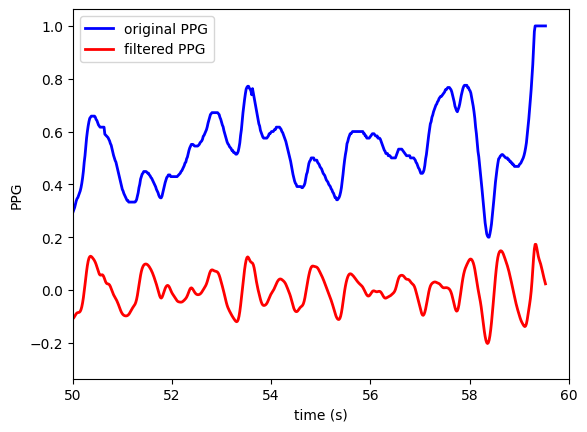
Note: The PPG signals in MIMIC have already been filtered somewhat by the clinical monitors used to record them.
Further work: Several different types of filters have been used to filter the PPG signal (e.g. Chebyshev filter, Butterworth filter). Have a look at this article for examples of several filter types (on pp.8-9). Which type of filter do the authors recommend? Can you re-design the filter above to use this type of filter?